
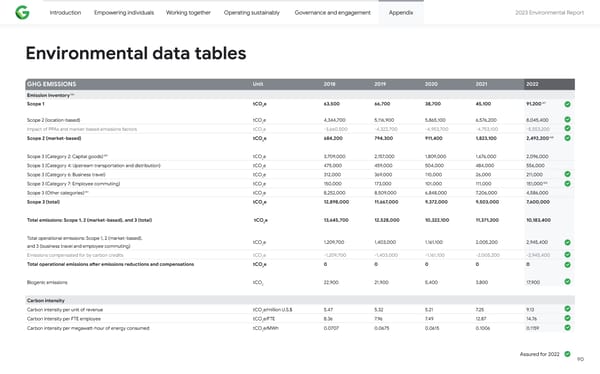
Introduction Empowering individuals Working together Operating sustainably Governance and engagement Appendix 2023 Environmental Repo爀琀 Environmental data tables GHG EMISSIONS Unit 2018 2019 2020 2021 2022 146 Emission inventory 147 Scope 1 tCO2e 63,500 66,700 38,700 45,100 91,200 Scope 2 (location-based) tCO e 4,344,700 5,116,900 5,865,100 6,576,200 8,045,400 2 Impact of PPAs and market-based emissions factors tCO e -3,660,500 -4,322,700 -4,953,700 -4,753,100 -5,553,200 2 148 Scope 2 (market-based) tCO2e 684,200 794,300 911,400 1,823,100 2,492,200 Scope 3 (Category 2: Capital goods) 149 tCO e 3,709,000 2,157,000 1,809,000 1,676,000 2,096,000 2 Scope 3 (Category 4: Upstream transpo爀琀ation and distribution) tCO e 475,000 459,000 504,000 484,000 556,000 2 Scope 3 (Category 6: Business travel) tCO e 312,000 369,000 110,000 26,000 211,000 2 150 Scope 3 (Category 7: Employee commuting) tCO e 150,000 173,000 101,000 111,000 151,000 2 151 Scope 3 (Other categories) tCO e 8,252,000 8,509,000 6,848,000 7,206,000 4,586,000 2 Scope 3 (total) tCO2e 12,898,000 11,667,000 9,372,000 9,503,000 7,600,000 Total emissions: Scope 1, 2 (market-based), and 3 (total) tCO2e 13,645,700 12,528,000 10,322,100 11,371,200 10,183,400 Total operational emissions: Scope 1, 2 (market-based), tCO e 1,209,700 1,403,000 1,161,100 2,005,200 2,945,400 2 and 3 (business travel and employee commuting) Emissions compensated for by carbon credits tCO e -1,209,700 -1,403,000 -1,161,100 -2,005,200 -2,945,400 2 Total operational emissions a昀琀er emissions reductions and compensations tCO2e 0 0 0 0 0 Biogenic emissions tCO2 22,900 21,900 5,400 3,800 17,900 Carbon intensity Carbon intensity per unit of revenue tCO e/million U.S.$ 5.47 5.32 5.21 7.25 9.13 2 Carbon intensity per FTE employee tCO e/FTE 8.36 7.96 7.49 12.87 14.76 2 Carbon intensity per megawa琀琀-hour of energy consumed tCO e/MWh 0.0707 0.0675 0.0615 0.1006 0.1159 2 Assured for 2022 90
 2023 Environmental Report Page 89 Page 91