
2023 Environmental Report
Google's 104 page PDF
Environmental Repo爀琀 2023
Introduction Empowering individuals Working together Operating sustainably Governance and engagement Appendix 2023 Environmental Repo爀琀 Introduction 3 Operating sustainably 31 Executive le琀琀ers 4 Our ambition 32 Our operat Highlights 6 ions 32 ero ca Our sustainability strategy 7 Net-z rbon 33 What’s Targets and progress summary 8 Water stewardship 49 Emerging oppo爀琀unities 9 Circular economy 55 inside Nature and biodiversity 67 Empowering individuals 12 Spotlight: Building a more sustainable 73 campus in Mountain View Our ambition 13 About this repo爀琀 Our approach 13 Governance and engagement 75 Helping people make 14 Google’s 2023 Environmental Repo爀琀 provides an overview of our environmental more sustainable choices About Google 76 1 sustainability strategy and targets and our annual progress towards them. Sustainability governance 76 Reducing home energy use 14 This repo爀琀 features data, pe爀昀ormance highlights, and progress against our Risk management 77 targets from our 2022 昀椀scal year (January 1 to December 31, 2022). It also mentions Providing sustainable 17 some notable achievements from the 昀椀rst half of 2023. A昀琀er two years of transpo爀琀ation options Stakeholder engagement 78 condensed repo爀琀ing, we’re sharing a deeper dive into our approach in one place. Sharing other actionable information 19 Public policy and advocacy 79 ADDITIONAL RESOURCES The journey ahead 19 Pa爀琀nerships 83 • 2023 Environmental Repo爀琀: Executive Summary Awards and recognition 84 • Sustainability.google Working together 20 • Sustainability repo爀琀s Appendix 85 Our ambition 21 • Sustainability blog Our approach 21 Repo爀琀ing approach and methodology 86 • Our commitments Suppo爀琀ing pa爀琀ners 22 Environmental data tables 90 • Alphabet environmental, social, and governance (ESG) Investing in breakthrough innovation 28 Environmental repo爀琀ing frameworks index 96 • About Google Creating ecosystems for collaboration 29 Endnotes 101 The journey ahead 30 Glossary 103 2
Introduction Empowering individuals Working together Operating sustainably Governance and engagement Appendix 2023 Environmental Repo爀琀 Executive le琀琀ers SVP of Learning and Sustainability Chief Sustainability O昀케cer Introduction Highlights Our sustainability strategy Targets and progress summary Emerging oppo爀琀unities AI for sustainability Our gigaton aspiration 3
Introduction Empowering individuals Working together Operating sustainably Governance and engagement Appendix 2023 Environmental Repo爀琀 data centers is di昀케cult. Despite this, we remain focused on Executive le琀琀ers developing new ways to make AI computing more e昀케cient By making information accessible and while leveraging the oppo爀琀unities that AI presents to have a positive environmental impact. accelerating innovation, we can help A le琀琀er from our Senior Vice President create a more sustainable future. Beyond our own footprint, Google’s founding mission— of Learning and Sustainability “Organize the world’s information and make it universally accessible and useful”—can play a very impo爀琀ant role in more extreme weather (昀氀ood forecasting, for instance), accelerating progress in climate information and action. I was introduced to the problem of climate change in the late optimizing systems from tra昀케c lights to car routes, and A sustainable future will be built upon billions of decisions 1980s through a prescient class I took as an undergraduate. mitigating climate change in new ways, for example. made by governments, organizations, and individuals, The models were less sophisticated and more unce爀琀ain than which will need to be grounded in good information. they are today, but the implications were already worrying. In our 2023 Environmental Repo爀琀, we’re highlighting how Increasingly, we see through Google Trends that more Thi爀琀y years later much has changed. The threat is now these themes of information and innovation run through and more people are looking for ways to live sustainably. more immediate, but the world is also taking action—from much of our work: I believe that we have many strengths and capabilities in governmental policy and technology innovation to actions providing quality information that people are seeking to by individuals and organizations—driven by a broader For information, we’ll feature Google Trends make decisions that’ll drive positive action for our planet. awareness of the danger. insights alongside key initiatives to show how our work is informed by societal trends Helpful information can be critical in both e昀昀o爀琀s to reduce I worked on Search for 20 years, leading the product for and expectations. emissions as well as adapt to extreme climate events like many of those, and learned a lot about the unique impact And for innovation, we’ll call out the many 昀氀oods, wild昀椀res, and heat waves. But this information o昀琀en Google can have on the world. I’ve always been proud places where AI is helping to break down lives in silos and is hard to access. Making the information of Google’s leadership in pushing the boundaries of barriers and advance our work. accessible and useful can be a tough technical challenge. sustainability in our data centers, including achieving carbon Our products like Environmental Insights Explorer, Ea爀琀h neutrality in 2007 (at the time, such accomplishments were Over my tenure at Google, I’ve seen how we’ve been Engine, and Data Commons are key solutions to suppo爀琀 uncommon). Going fu爀琀her, we’ve matched 100% of our working to integrate sustainability into our work. This the decisions that cities and organizations will have to global electricity use with renewable energy purchases for transition is going to be challenging—both for us and for make. Information can also have a signi昀椀cant impact the last six years—a goal that seemed almost crazy when the world at large—and there’s no playbook for making on the decisions of individuals—pa爀琀icularly in the areas we set it in 2012. it happen. But we see our e昀昀o爀琀s as pa爀琀 of a bigger of home energy and transpo爀琀ation. Our products like picture, se琀琀ing our goals to help scale global solutions, Today our ambitions have evolved—we now have a bold Maps, Search, and Nest reach billions of users around the and I’m optimistic that we can, through our e昀昀o爀琀s in both goal to achieve net-zero emissions across all of our world, and we’re building many features to respond to the information and innovation, play a helpful role in building a operations and value chain, and as pa爀琀 of that goal, to demand for that information in our products. more sustainable and resilient future. run on 24/7 carbon-free energy on every grid where we Given the scale of the problem, innovation will also be operate. The path to get to these goals is di昀케cult, and we’re commi琀琀ed to working through the challenges we face with key to ge琀琀ing us to a be琀琀er future. In order to push the Benedict Gomes frontiers of innovation, Google has long had a world-class the ultimate aim of driving larger systems change to create Benedict Gomes research organization that’s been at the forefront of AI and a more sustainable future. Fu爀琀her, predicting the future SVP, Learning & Sustainability machine learning. These solutions can help in predicting growth of energy use and emissions from AI compute in our Google 4
Introduction Empowering individuals Working together Operating sustainably Governance and engagement Appendix 2023 Environmental Repo爀琀 A le琀琀er from our Chief Sustainability O昀케cer sustainability strategy, which focuses on where we can make the most signi昀椀cant positive impact. Our work In 2022, we signed contracts for is organized around three key pillars: empowering I grew up in Muir Beach, California, and was fo爀琀unate individuals to take action, working together with approximately 2.8 GW of clean energy to spend my childhood exploring its beautiful redwood our pa爀琀ners and customers, and operating our generation capacity—more than in forests and vibrant tidepools with my family. Today, I’m business sustainably. any prior year. raising my daughter in these same special places, but now these delicate ecosystems are threatened, just like many In 2022, we reached our goal to help 1 billion people other pa爀琀s of the world. make more sustainable choices through our products. We achieved this by o昀昀ering sustainability features like Climate change a昀昀ects all aspects of society, from food eco-friendly routing in Google Maps, energy e昀케ciency • We opened our new Bay View campus, which is production and human health to infrastructure and the features in Google Nest thermostats, and carbon all-electric, net water-positive, restores over 17 acres economy. These impacts are interconnected and can have emissions information in Google Flights. Looking ahead, of high-value nature, and incorporates the leading a cascading e昀昀ect on people and the planet. The response our aspiration is to help individuals, cities, and other principles of circular design. calls for systemic, global action to reduce emissions, pa爀琀ners collectively reduce 1 gigaton of their carbon • We signed 20 more renewable energy agreements, improve watershed health, maximize the reuse of 昀椀nite 2 equivalent emissions annually by 2030. bringing our total to more than 80 agreements resources, and protect biodiversity. totaling approximately 10 GW of clean energy A昀琀er two years of condensed repo爀琀ing, we’re sharing a generation capacity—we estimate we’ll spend Since Google was founded, our e昀昀o爀琀s to mitigate climate deeper dive into our approach in one place in our 2023 approximately $10 billion to purchase clean energy change have sta爀琀ed with our own operations, and we’ve Environmental Repo爀琀. In 2022, we continued to make 4 through 2040. worked hard to lead by example with the ultimate goal measurable progress in many key ways, such as: of driving larger systemic change. In our third decade We expect this new era of technological innovation to of climate action, we’ll continue to take a science-based • We enhanced and launched new sustainability open up even greater oppo爀琀unities to accelerate system- approach to our e昀昀o爀琀s, while sharing our own lessons product features, such as eco-friendly routing in level change. It’s a big pa爀琀 of the reason we’re optimistic and progress with others. Maps, which is estimated to have helped prevent about what’s possible in the years ahead. If we move more than 1.2 million metric tons of carbon emissions forward collectively and decisively, there’s no limit to I joined Google eight years ago to lead our sustainability from launch through 2022—equivalent to taking what we can achieve. e昀昀o爀琀s, and have witnessed our sense of urgency and approximately 250,000 fuel-based cars o昀昀 the road ambition 昀椀rsthand. We’re empowering individuals, 3 for a year. Kate E. Brandt governments, businesses, and other organizations to • We expanded the availability of Google Ea爀琀h make decisions that can drive positive action for people Kate E. Brandt Engine—which provides access to reliable, up-to- and our planet. Chief Sustainability O昀케cer date insights on how our planet is changing—to Google include businesses and governments worldwide as an The oppo爀琀unity we have through our products and enterprise-grade service through Google Cloud. pla琀昀orms is re昀氀ected in our updated environmental 5
Introduction Empowering individuals Working together Operating sustainably Governance and engagement Appendix 2023 Environmental Repo爀琀 Highlights This section provides a snapshot of our highlights as of the end of 2022, and select highlights from the 昀椀rst half of 2023. For a more complete overview of our pe爀昀ormance over time, see the Targets and progress summary section and our Environmental data tables. 1 billion users 1.2 million metric tons 113 billion kWh 99% of itineraries Our core products helped more than of estimated carbon emissions reductions of energy cumulatively saved by customers on Google Flights included carbon 1 billion users make more sustainable enabled by Google Maps eco-friendly using Nest thermostats from 2011 to 2022 6— emissions estimates Empowering choices in 2022 routing as of the end of 2022—equivalent to more than double Po爀琀ugal’s annual electricity 7 individuals taking approximately 250,000 fuel-based consumption and equivalent to preventing 5 8 cars o昀昀 the road for a year an estimated 36 million tCO e emissions 2 40,000+ cities 400 sta爀琀ups 80 countries 100s of sources Environmental Insights Explorer made suppo爀琀ed by our Sta爀琀ups for Sustainable are included in our Flood Hub pla琀昀orm, of sustainability data, from most actionable climate data available to more Development program in over 60 countries, covering 460 million people globally, and real- OECD countries, aggregated by Working than 40,000 cities and provided Tree and global researchers, academics, and time wild昀椀re boundaries in Search and Maps Data Commons—making data more together Canopy Insights to more than 350 cities NGOs suppo爀琀ed with climate- and nature- are available in cities around the world accessible and useful for addressing related data and analytics sustainability challenges 10+ GW 271 million gallons 100% 44 acres of clean energy generation capacity from of water replenished as of the end of 2022— of Pixel, Nest, and Chromecast devices of native habitat restored on our 9 Operating more than 80 signed agreements from 2010 equivalent to more than 400 Olympic-sized launched in 2022 include recycled materials Bay Area campuses as of the end to 2022—the equivalent capacity of more swimming pools of 2022 sustainably than 31 million solar panels 6
Introduction Empowering individuals Working together Operating sustainably Governance and engagement Appendix 2023 Environmental Repo爀琀 Our sustainability Information and innovation strategy We’re helping to lead the transition to a more sustainable future by making information accessible and by driving innovation forward. We believe Google has a unique oppo爀琀unity that extends beyond managing the environmental impacts of our own operations and value chain. Empowering individuals Working together with our Operating our to take action pa爀琀ners and customers business sustainably By making information accessible and by driving innovation forward through our products and pla琀昀orms that billions of people engage with every day, we’re helping individuals, businesses, and other organizations We’re empowering people with the We’re helping pa爀琀ners and customers We’re building on our legacy of make decisions that can drive positive action for people information they’re seeking to help to reduce their emissions and achieve sustainability leadership by accelerating and our planet. In shaping our strategy, we consider make more sustainable choices in their sustainability goals by advancing the transition to a net-zero carbon future, where we can make the most signi昀椀cant positive everyday lives. transformative technology for advancing water stewardship, building a impact. Our work is focused on three key pillars: sustainability and climate action. circular economy, and protecting nature empowering individuals to take action, working together and biodiversity. with our pa爀琀ners and customers, and operating our business sustainably. Learn more in the Learn more in the Learn more in the gether section Operating sustainably section Empowering individuals section Working to 7
Introduction Empowering individuals Working together Operating sustainably Governance and engagement Appendix 2023 Environmental Repo爀琀 Targets and progress summary Topic Target Unit 2021 2022 Target year Status Help 1 billion people make more sustainable choices through our Users More than 2022 Achieved Products N/A Product impact products by 2022 10 (see pg. 14) 1 billion Achieve net-zero emissions across all of our operations and value chain by 2030 Net-zero Reduce 50% of our combined Scope 1, 2 (market-based), Ongoing Carbon tCO 11 e emissions 10.2 million before 2030 2 N/A (see pg. 36) and 3 absolute emissions (versus our 2019 baseline) before 2030 carbon reduction Ongoing Carbon-free % carbon-free energy 64% 12 2030 Run on 24/7 carbon-free energy on every grid where we operate by 2030 66% (see pg. 43) energy Replenish more water than we consume and help improve water quality and ecosystem health in the communities where we operate Water stewardship % freshwater Ongoing Replenish 120% of the freshwater volume we consume, Water 6% 2030 N/A (see pg. 52) replenished on average, across our o昀케ces and data centers by 2030 replenishment Operational targets Maximize the reuse of 昀椀nite resources across our operations, products, and supply chains Data % of data centers at 38% N/A Ongoing Achieve Zero Waste to Land昀椀ll for our global data center operations 30% (see pg. 57) Zero Waste to Land昀椀ll centers 85% 2025 Ongoing % food waste dive爀琀ed Dive爀琀 all food waste from land昀椀ll by 2025 O昀케ces N/A (see pg. 60) Circular Use recycled or renewable material in at least 50% of plastic used across economy % recycled/ 41% 2025 Ongoing 36% our consumer hardware product po爀琀folio by 2025 (see pg. 62) renewable material Consumer hardware products % plastic-free Ongoing 96% 2025 Make product packaging 100% plastic-free by 2025 97% packaging (see pg. 63) Signi昀椀cant Achieve UL 2799 Zero Waste to Land昀椀ll ce爀琀i昀椀cation at all 昀椀nal 90% 2022 % of sites ce爀琀i昀椀ed Supply chain 9% progress assembly consumer hardware manufacturing sites by 2022 (see pg. 65) 8
Introduction Empowering individuals Working together Operating sustainably Governance and engagement Appendix 2023 Environmental Repo爀琀 Emerging oppo爀琀unities As the world becomes increasingly aware of the need for sustainability, individuals, businesses, and communities are looking for new ways to reduce their environmental impact. A爀琀i昀椀cial intelligence (AI) and the power of information to help individuals and organizations reduce emissions are two emerging oppo爀琀unities that Google is focusing on to help build a more sustainable future. AI for sustainability Seven years into our journey as an AI-昀椀rst company, we’ve emissions since launch—equivalent to taking approximately 14 made AI foundational to every pa爀琀 of our business and 250,000 fuel-based cars o昀昀 the road for a year. Our planet, as seen via Google Ea爀琀h ©2020 Landsat / Copernicus all Google products. Our approach to AI must be both bold and responsible. To us, that means developing AI in a Additionally, for over a decade, our Nest Learning way that maximizes the positive bene昀椀ts to society while Thermostats have used machine learning (ML) to help addressing the challenges, guided by our AI Principles. people save energy and money at home. From 2011 to 2022, Nest thermostats have helped customers We believe that AI is a foundational and transformational technology that will provide compelling and helpful We can use AI to help accelerate solutions to tackle cumulatively save more than 113 billion kWh of bene昀椀ts to people and society through its capacity to assist, complement, empower, and inspire people in 15 climate change by providing be琀琀er information to energy —more than double Po爀琀ugal’s annual electricity almost every 昀椀eld of human endeavor. It has the potential to contribute to tackling some of society’s most 16 individuals, operational optimization for organizations, consumption and equivalent to avoiding an estimated pressing challenges and oppo爀琀unities—among these, climate and sustainability, where we’re researching 17 and improved prediction and forecasting. We must 36 million tCO e emissions. 2 and innovating to help unlock scienti昀椀c discoveries and to assist people in making informed choices and also continue to 昀椀nd ways to reduce the environmental communities impacted by climate change. footprint of AI models. Optimization: Bringing carbon-e昀케cient computing to customers and pa爀琀ners. We’ve made signi昀椀cant We believe that ge琀琀ing AI right—which to us involves innovating and delivering widely accessible bene昀椀ts to Information: Empowering people to live more investments in cleaner cloud computing by making our people and society, while mitigating its risks—must be a collective e昀昀o爀琀 involving us and others, including sustainably through AI. In 2022, searches for data centers some of the most e昀케cient in the world researchers, developers, users (individuals, businesses, and other organizations), governments, regulators, “solar energy,” “electric bicycles,” and and sourcing more carbon-free energy. We’re helping and citizens. It’s critical that we collectively earn public trust if AI is to deliver on its potential for people and 13 “electric cars” reached all-time highs. People are our customers make real-time decisions to reduce society. As a company, we embrace the oppo爀琀unity to work with others to get AI right. interested in how to live more sustainably, and our goal is to emissions, and mitigate climate risks with data and AI. make it easier for them to do so. Features like eco-friendly For example, Google Cloud customers can reduce their James Manyika routing in Google Maps leverage AI to help people get to cloud footprint with a feature called Active Assist, which SVP, Research, Technology, & Society their destinations as quickly as possible while minimizing uses machine learning to identify unused (and potentially Google fuel or ba琀琀ery consumption. Eco-friendly routing has wasteful) workloads that could reduce carbon emissions helped prevent 1.2 million metric tons of estimated carbon if removed. 9
Introduction Empowering individuals Working together Operating sustainably Governance and engagement Appendix 2023 Environmental Repo爀琀 Flood Hub, which allows local governments and aid With AI at an in昀氀ection point, predicting the future growth We’re excited about the progress we’ve already made organizations to identify when a riverine 昀氀ood will occur, of energy use and emissions from AI compute in our data in developing more sustainable tools and products that up to seven days in advance. In early 2023, we expanded centers is challenging. Historically, research has shown harness the power of AI, and we’re optimistic about the We’re making advancements in many this tool from 20 to 80 countries across the globe. By using that as AI/ML compute demand has gone up, the energy progress we’ll unlock in the years ahead. transformative areas of AI, but I’m pa爀琀icularly excited about AI for Social Good, including AI to analyze satellite imagery, we’re also helping to enable needed to power this technology has increased at a much climate adaptation. AI has great potential to rapid detection when a wild昀椀re sta爀琀s and to predict how it slower rate than many forecasts predicted. We have will spread, enabling authorities to be琀琀er manage 昀椀res and used tested practices to reduce the carbon footprint of both reduce overall emissions as well as help us provide emergency ale爀琀s to individuals who are at risk. workloads by large margins; together these principles address the e昀昀ects of climate change, including have reduced the energy of training a model by up to AI is one of the most transformational helping people adapt to new challenges. Prediction: Using AI to predict locust outbreaks, 100x and emissions by up to 1,000x. We plan to continue technologies of our time. I believe it has helping farmers protect their crops. Locust infestations applying these tested practices and to keep developing the potential to unlock major bene昀椀ts for Je昀昀 Dean can have a devastating e昀昀ect on food crops. Through new ways to make AI computing more e昀케cient. us all, including tackling climate change. Chief Scientist collaborations with AI product-focused company At Google DeepMind, we’re commi琀琀ed to Google DeepMind and InstaDeep and the Food and Agriculture Organization Google data centers are designed, built, and operated to driving responsible research that can make Google Research (FAO) of the United Nations, the Google AI Center maximize e昀케ciency—even as computing demand grows. a positive and lasting impact on society. in Ghana is building a model that forecasts locust On average, a Google-owned and -operated data center I’m hopeful AI will accelerate scienti昀椀c breeding grounds using historical data from the FAO and is more than 1.5 times as energy e昀케cient as a typical progress and help us address a number of Optimization: Helping communities with AI-powered 19 environmental variables like rainfall and temperature. enterprise data center and, compared with 昀椀ve years global challenges to leave the world a be琀琀er climate action planning. Green Light is an AI-based tool This model will help to be琀琀er detect locust outbreaks and ago, we now deliver approximately three times as much place for the generations that follow. that helps city tra昀케c engineers optimize the timing of enable farmers to implement control measures. computing power with the same amount of electrical 20 light changes to reduce stop-and-go tra昀케c. Our recent power. To suppo爀琀 the next generation of fundamental Lila Ibrahim tests in Hamburg, Germany, showed that at tra昀케c lights Prediction: Using generative modeling for nowcasting advances in AI, our latest TPU v4 is proven to be one Chief Operating O昀케cer with our AI-driven recommendations, cars made over rain. We’re using generative modeling to make detailed of the fastest, most e昀케cient, and most sustainable ML Google DeepMind 25% fewer stops, resulting in approximately 10% fewer and plausible predictions, up to two hours ahead, that infrastructure hubs in the world. 18 emissions. The Environmental Insights Explorer (EIE) is capture the amount, timing, and location of rainfall. a freely available online tool built with and for cities and With such methods, we can both accurately capture regions to suppo爀琀 e昀昀ective climate action planning. large-scale events, while also generating alternative rain Many features in EIE are made possible through machine scenarios. We’re interested in the ability of these models learning, such as estimating the solar potential of roo昀琀ops, to make predictions on medium- to heavy-rain events, calculating transpo爀琀ation emissions, and mapping tree which most impact people and the economy. canopy coverage. Environmental footprint: Leveraging AI to optimize Prediction: Using AI to help communities address our own operations, and working to reduce energy use extreme weather events. AI-powered tools can help and emissions from AI computing in our data centers. address some of the worst impacts of climate-related AI and machine learning workloads are quickly becoming A row of servers in our disasters, from early warnings of natural disasters to larger and more capable, raising concerns about their St. Ghislain, Belgium, data center reducing the impact of wild昀椀res. In 2022, we launched energy use and their impact on the environment. 10
Introduction Empowering individuals Working together Operating sustainably Governance and engagement Appendix 2023 Environmental Repo爀琀 Approaches Inherent unce爀琀ainty Our gigaton aspiration Unce爀琀ainty is inherent to most GHG accounting Consider carbon accounting principles methodologies and results, and it increases when considering enabled emissions reductions due to a lack Established carbon accounting principles (such as well- We believe that Google has a unique For context, 1 GT is comparable to the entire annual of primary data and precise information about real-world de昀椀ned baselines and true and fair representation of 22 emissions of Japan. Helping others to reduce 1 GT of oppo爀琀unity that extends beyond reducing actions and their e昀昀ects. However, understanding the data) provide helpful insights as we develop estimation carbon equivalent emissions per year, sta爀琀ing in 2030, is the environmental impacts of our own sources, types, and magnitude of unce爀琀ainty is crucial methodologies for enabled emissions reductions. a bold aspiration focused on where we can have the most to deploy conservative estimates, inform improved data 21 operations and value chain. impact—enabling others to reduce emissions in key areas Quantify and evaluate real world action inputs, and properly interpret results. like energy and transpo爀琀ation. Our ultimate measure of The data available to us from our technology, products, In 2020, Google shared our aspiration to help others reduce success will be how much we’ve helped individuals, cities, While carbon accounting principles and these concepts or services may be several steps removed from actual, 1 gigaton (GT) of their carbon equivalent emissions annually and other pa爀琀ners to achieve their own greenhouse gas are a good sta爀琀 towards estimating enabled emissions real-world action and impact that resulted in reduced by 2030. This is an ambitious vision that we’ve set to push us (GHG) emissions reduction goals. reductions, we expect that methodologies will rapidly or avoided emissions. We’ll have to use inference and to contribute meaningfully to helping with climate solutions evolve, and we welcome the oppo爀琀unity to collaborate judgment to evaluate the e昀昀ect of those actions. beyond our own operations and value chain. Many of the solutions to achieve a gigaton of carbon with others to advance best practices. emission reductions don’t yet exist. However this ambition Challenges We initially focused on helping cities and local pushes us to innovate and be audacious in our approach The Empowering individuals and Working together governments reduce 1 GT of emissions. A key tool in this and to collaborate with others to drive systemic solutions. Unintended impacts sections include many examples of how we’re already e昀昀o爀琀 is the Environmental Insights Explorer (EIE), which We’ll share progress and learnings along the way. suppo爀琀ing and enabling individuals and pa爀琀ners to Emissions reduction e昀昀o爀琀s don’t happen in isolation. provides actionable climate and sustainability data to reduce their emissions. Actions in one industry or sector might result in net new government o昀케cials in cities and regions worldwide. It’s emissions in another. Similarly, emissions reductions in been used in multiple ways across the globe, including by Estimating impact one area can sometimes lead to increases in another. city leaders in Dublin to analyze bicycle usage and inform These are di昀케cult e昀昀ects to control for, but they must be sma爀琀 transpo爀琀ation policies, and by the city of Austin to Estimating the carbon impact of actions taken by many considered when estimating enabled emissions reductions. prioritize planting trees in areas with the highest need. millions of people, communities, and organizations will be inherently di昀케cult, imprecise, and fundamentally di昀昀erent To be琀琀er re昀氀ect the broader group of pa爀琀ners we aim to from measuring a corporate carbon footprint. However, help, we’re updating our shared ambition: it’s also useful to enable us to prioritize the most helpful solutions for others. ASPIRATION A昀琀er reviewing emerging best practices and applying our We aim to help individuals, cities, internal product measurement expe爀琀ise to advance our measurement work, we’ve identi昀椀ed a set of approaches and other pa爀琀ners collectively reduce and known challenges that will inform how we estimate 1 gigaton of their carbon equivalent enabled emissions reductions. emissions annually by 2030. The Environmental Insights Explorer makes actionable climate data available to more than 40,000 cities and regions worldwide. 11
Introduction Empowering individuals Working together Operating sustainably Governance and engagement Appendix 2023 Environmental Repo爀琀 Our ambition Empowering Our approach Helping people make more individuals sustainable choices Reducing home energy use We’re empowering people Providing sustainable with information to make transpo爀琀ation options more sustainable choices Sharing other actionable information The journey ahead 12
Introduction Empowering individuals Working together Operating sustainably Governance and engagement Appendix 2023 Environmental Repo爀琀 Our ambition Our approach Every day, billions of people turn to Google to ask FIGURE 1 At Google, we have an oppo爀琀unity to lead the transition to a more sustainable future questions, discover something new, or learn about what’s See hybrid and electric vehicle options on Google Search by making information accessible and by impo爀琀ant to them. More people are interested in how to When people search for car models and brands, we tag hybrid and electric options to make them easier to 昀椀nd. live more sustainably than ever, and our aim is to make it driving innovation forward. Grounded in And when people look into a speci昀椀c EV, we show compatible charging stations nearby and typical charge times. easier for them to do so. In 2022, searches for our mission, we’re empowering people with “solar energy,” “electric bicycles,” and the high-quality information they’re looking “electric cars” reached all-time highs. 23 for. Through our products and pla琀昀orms that billions of users engage with every day, These kinds of changes to lifestyles and behavior ma琀琀er: we’re helping people make decisions that the International Energy Agency (IEA) estimates that can drive positive action for our planet. around 55% of the cumulative emissions reductions needed to achieve a net-zero global energy system by 2050 are linked to consumer choices. Yet, there’s a wide Last year’s Intergovernmental Panel on Climate Change “say-do gap” among consumers—between those who are (IPCC) AR6 Working Group 3 Repo爀琀, for the 昀椀rst time, concerned about sustainability, and those who ultimately set out measurable ways that individuals can take 24 make sustainable decisions. meaningful climate action in line with the Paris Agreement. The IPCC repo爀琀 o昀昀ers a detailed and practical plan To tackle a problem at the scale of climate change, it for societal emissions reduction, complementing the can be hard to know where to sta爀琀. That’s why we’ve critical action required by governments, policymakers, taken a 昀椀rst-principles approach, looking at what’s and organizations to decarbonize energy, transpo爀琀, and contributing the most to global emissions. Home energy material systems. The repo爀琀 also calculates the signi昀椀cant and transpo爀琀ation are two such areas—collectively well-being and economic bene昀椀ts that will result from 25 they account for more than 20% of emissions. They’re these actions, including for individuals. also sectors where people are actively searching for sustainable alternatives that o昀琀en provide bene昀椀ts like These impo爀琀ant 昀椀ndings have reinforced our conviction saving them money or time, or improving their health. that Google can make a meaningful di昀昀erence beyond our own operations and value chain, and they highlight The accuracy and quality of the information that informs the bene昀椀ts of helping individuals through our products these decisions is critical. When people come to us and pla琀昀orms. looking for answers, we aim to provide high-quality and authoritative information. 13
Introduction Empowering individuals Working together Operating sustainably Governance and engagement Appendix 2023 Environmental Repo爀琀 Helping people make more TARGET 2022 PROGRESS sustainable choices Help 1 billion people make Achieved: Helped more than more sustainable choices 1 billion users make more In 2020, we announced a goal to help 1 billion people make • Google Maps: Eco-friendly routing feature that shows more sustainable choices through our products by 2022. users the most fuel-e昀케cient route, based on factors through our products by 2022 sustainable choices We’re pleased to share that we reached that goal in 2022, such as tra昀케c and road incline. through innovative solutions o昀昀ered to users, including: • Google Travel: Users can see associated carbon DETAILS • Google Nest: Programmable energy e昀케ciency emissions for nearly every 昀氀ight, sustainability Year set: 2020 | Base year: N/A | Target year: 2022 ce爀琀i昀椀cations and a琀琀ributes for hotels, and quickly Scope: Unique, signed-in Google users that were provided information so they could make a more schedules for homes that can help users save energy, 昀椀nd more sustainable options. sustainable choice by at least one sustainability product feature. money, and carbon emissions throughout the day. Reducing home FIGURE 2 energy use Google Shopping feature for water heaters We’ve launched a number of products and features to help people make more informed choices about the products they buy and the energy they use. Energy-e昀케cient products Searches for “how to save energy” reached a 10-year 26 high, worldwide, in 2022. And global searches for 27 “heat pumps” reached an all-time high in 2022. When someone uses Google Search in the U.S. to look for furnaces or water heaters, suggestions in the Shopping tab can help narrow their search to cost-e昀昀ective and e昀케cient options (see Figure 2). Nest thermostats help people save energy at home. 14
Introduction Empowering individuals Working together Operating sustainably Governance and engagement Appendix 2023 Environmental Repo爀琀 Features such as Energy Shi昀琀 gather local power grid FIGURE 3 Sma爀琀 thermostats emissions forecasts and identify oppo爀琀unities where Nest Renew features heating or cooling a home slightly earlier or later would Nest thermostats help control residential heating and mean taking advantage of cleaner energy. These small cooling systems, saving energy in a variety of ways. actions add up; as of December 2022, we estimate that The collective impact of these savings is signi昀椀cant. 32 33 Energy Shi昀琀 has already helped Nest Renew users From 2011 to 2022, Nest thermostats have helped collectively prioritize cleaner energy usage for more than customers cumulatively save more than 113 billion 110 million hours. 28 kWh of energy —more than double Po爀琀ugal’s annual 29 electricity consumption —and equivalent to preventing For people who want to do more to suppo爀琀 the growth 30 an estimated 36 million tCO e emissions. In 2022 alone, 2 of clean energy from their homes, Google o昀昀ers Nest Nest thermostats helped customers save more than Renew Premium as a paid subscription option. It matches 31 26 billion kWh of energy —more energy than Google used the fossil fuel electricity used in their home with enough in the same year. clean energy to cover the average U.S. household. We’re working with renewable energy plants that suppo爀琀 projects in Google’s own po爀琀folio—like the Bethel Wind plant in Castro County, Texas—to purchase high-quality Nest thermostats use AI and machine learning renewable energy credits for Nest Renew customers, to reduce energy consumption and achieve beyond Google’s existing clean energy purchases. collective savings as they learn how and when to keep customers comfo爀琀able, while optimizing People can also access features like impact repo爀琀s and for energy e昀케ciency. the Energy Impact Program, which lets them direct Nest Renew funds to nonpro昀椀t pa爀琀ners working toward an equitable sustainable future (see Figure 3). Clean energy 2022 HIGHLIGHT Because electricity grids tend to be cleaner at ce爀琀ain times of day, when we use electricity can be as impo爀琀ant In 2022 alone, Nest thermostats as how much electricity we use. That’s why we launched helped customers save more than 26 34 Nest Renew in the United States to help individuals billion kWh of energy —more energy automatically shi昀琀 their energy consumption to times of than Google used in the same year. day when local grid electricity is cleaner or less expensive 15
Introduction Empowering individuals Working together Operating sustainably Governance and engagement Appendix 2023 Environmental Repo爀琀 Information about FIGURE 4 energy Europe energy information panels Global search interest in “eco-anxiety” reached a 15-year high in 2022, as did search interest in how to 35 “save energy at home,” showing us that people want—and need answers. Due to the energy crisis in Europe, people, businesses, and governments across the continent are concerned about rising prices and increased pressure on the energy grid, which is evident from the information they’re searching for. In 2022, we worked with the IEA to rapidly develop a set of recommendations to help individuals reduce energy use at home. When people searched for topics such as “Europe energy crisis” and “energy price”, they saw news a爀琀icles, local information including 昀椀nancial assistance that may be available, and recommended actions to help conserve energy (see Figure 4). Going solar Global search interest in “solar energy” and 36 “solar installation” reached all-time highs in 2022. Project Sunroof, launched in 2015 in the United States and Pue爀琀o Rico, helps people decide whether to go solar. It uses AI to analyze high-resolution aerial mapping and 3D modeling of residential roofs, making estimations of solar potential faster and easier. Exploring potential solar capacity for homes in San Francisco, California in the Project Sunroof tool. 16
Introduction Empowering individuals Working together Operating sustainably Governance and engagement Appendix 2023 Environmental Repo爀琀 Since the most fuel-e昀케cient route will vary by engine and emissions. We also show which models qualify in type, drivers using eco-friendly routing in Europe, Egypt, the U.S. under the latest government rebate programs Providing sustainable transpo爀琀ation the U.S., and Canada can now select their engine type— designed to help make EVs a more a昀昀ordable option. For options petrol or gas, diesel, hybrid, or electric vehicle (EV)—in people considering a new bike or scooter, in select Asian order to get the best route and most accurate fuel or countries, Search provides information such as range, Global search interest in “sustainable transpo爀琀” FIGURE 5 energy e昀케ciency estimates. speed, and price for electric bikes and scooters. 37 reached a 15-year high in 2022. Transpo爀琀ation relies Eco-friendly routing When EV owners search for “EV charging” on Google 38 more heavily on fossil fuels than any other sector. Electric vehicles Maps, they’ll see charging stations nearby with charger This is why, for people in most high-income countries, availability displayed in some cases. People with a car changing travel pa琀琀erns is a high-impact way to reduce that has Google Maps built in are routed to the most EVs accounted for nearly 14% of new global car sales in their footprint. We’ve added several features across our 41 2022, and global search interest for “electric vehicles” convenient charging location based on factors like tra昀케c, products to allow people to more easily make sustainable 42 charge levels, and charger speed. By the end of 2022, reached an all-time high in 2022. travel and transpo爀琀ation decisions. Google Maps included nearly 300,000 EV charging locations globally. Eco-friendly routing For people considering purchasing a new vehicle, we want to make it easy to understand when switching to a In the Waze app, individuals can also 昀椀nd compatible hybrid or electric vehicle makes sense for them. Search A simple thing everyone can do to reduce emissions is charging stations along their route. Thanks to local map can help people 昀椀gure out how much they can save by use existing vehicles more e昀케ciently. Global searches for editors from our Waze Community, EV data is reviewed going electric by providing fuel savings estimates and “how to save fuel when driving” have increased by information about how similar cars compare in range and updated in real time to provide the most accurate, 39 60% between 2022 and 2023. In 2021, we launched eco- comprehensive information. friendly routing in Google Maps to help people get to their destinations as quickly as possible while minimizing fuel or ba琀琀ery consumption (see Figure 5). By building AI models on the emissions pro昀椀le of diverse vehicle types, this feature leverages insights from the U.S. Depa爀琀ment of Energy’s National Renewable Energy Laboratory and data from the European Environment Agency to optimize fuel-e昀케cient route choices. In 2022, we expanded eco-friendly routing to Canada and nearly 40 European countries, as well as in Egypt ahead of COP-27. As of the end of 2022, it’s estimated to have helped prevent more than 1.2 million metric tons of carbon emissions since launch—equivalent to taking approximately 250,000 fuel-based cars o昀昀 the road for 40 a year. An EV plugged in at a charging station. Finding a place to charge your EV is easy with Google Maps. 17
Introduction Empowering individuals Working together Operating sustainably Governance and engagement Appendix 2023 Environmental Repo爀琀 Sustainable commuting Long-distance travel “Less emissions only” 昀椀lter. In 2022, we expanded Over time, we’ve re昀椀ned and improved the TIM with help coverage of carbon emissions estimates to 99% of from academic and nonpro昀椀t expe爀琀s, as well as various itineraries on Google Flights. pa爀琀ners in the travel industry. We then formalized these One sustainable way to travel is to avoid driving When individuals search in Google Flights, they now see collaborative e昀昀o爀琀s by establishing an independent altogether, which is why we’re making it easier to use carbon emissions estimates for nearly every 昀氀ight, right We also created the Travel Impact Model (TIM), advisory commi琀琀ee to oversee future changes to the TIM. Google Maps for sustainable commuting in urban areas, next to price and duration (see Figure 6). Lower emissions a public and freely accessible methodology for predicting by providing mass transit options, bike routes, bike 昀氀ights are labeled with a green badge, and results can the per-passenger CO emissions produced by an Google Search can also help people 昀椀nd more shares, and walking directions. be so爀琀ed or 昀椀ltered by carbon impact. If people want to 2 upcoming 昀氀ight. Today, the TIM powers the emissions sustainable alternatives to 昀氀ying when available. view only 昀氀ights that have lower emissions compared to estimates you see on Google Flights, as well as select Trips taken by train or bus o昀琀en produce lower emissions By tapping on the Google Maps transit icon, individuals the average for similar trips, they can simply tap the travel sites, through our work in the Travalyst coalition. and can frequently save individuals time or money over can get directions to their destination by bus, train, sho爀琀er distances. subway, and even ferry. Google Maps provides, on average, more than 2 billion kilometers (1.2 billion miles) People can now compare train ticket prices directly on of public transit results per day. FIGURE 6 Google Search for travel in and around select countries. As Google Flights emissions estimates an example, when looking for “Berlin to Vienna trains,” Global searches for “e-bikes” have doubled over individuals will see a new module in the search results that 43 the past three years. In 2022, we added over 90,000 lets them choose their depa爀琀ure date and compare the kilometers (56,000 miles) of bike lanes and bikeable available options. To fu爀琀her expand individual choices for roads to Google Maps. Individuals can also 昀椀nd nearby intercity travel, we’ve also sta爀琀ed testing a similar feature bike and scooter shares in over 400 cities around for bus tickets. the world. We’re also helping people get from point A to point B Hotel accommodations on foot. Google Maps o昀昀ers turn-by-turn directions for pedestrians, with Immersive View and Street View When people search for travel accommodations, they o昀昀ering route previews, and Live View, which uses can see which hotels have been ce爀琀i昀椀ed for meeting augmented reality to display arrows and directions high standards of sustainability by select independent clearly overlaid on the map. organizations. For example, hotels ce爀琀i昀椀ed by Green Key or Ea爀琀hCheck will have an eco-ce爀琀i昀椀ed badge next to their name. 2022 HIGHLIGHT Google Maps provides, on average, more than 2 billion kilometers (1.2 billion miles) of public transit results per day. 18
Introduction Empowering individuals Working together Operating sustainably Governance and engagement Appendix 2023 Environmental Repo爀琀 Recycling points Sharing other actionable information The journey People recognize that recycling plays a crucial role in preserving the future of our planet; global searches for ahead Outside of home energy and transpo爀琀ation, individuals Climate change “recycling” are the highest of any sustainability action. 45 can make other sustainable choices that add up to create While a single individual’s actions may seem small, when a positive impact. This includes understanding local air information In 2021, we launched a new feature that makes it easier for billions of people have the tools to make more sustainable quality, accessing climate change information, identifying people to 昀椀nd nearby recycling points on Search and Maps. decisions, they add up to have a meaningful impact on nearby recycling locations, or purchasing pre-owned items. In addition to providing information on recycling depots We’re making it easier for people to 昀椀nd climate change their communities and the entire planet. information. When people search for “climate change” and waste transfer stations, we’re also helping small businesses share when they o昀昀er in-store recycling. By in ce爀琀ain languages, they’ll see information panels and Air quality We’re excited by the oppo爀琀unity to enable climate and adding the new recycling a琀琀ribute to Business Pro昀椀les on visuals on the causes and e昀昀ects of climate change, and Search and Maps, local storefronts and shops can show environmental action far beyond Google’s direct impact, individual actions they can take to live more sustainably, through information and innovation. Air quality around the world is being negatively impacted provided by authoritative sources like the United Nations. the recycling services they o昀昀er in just a few clicks— by air pollution and increasingly severe wild昀椀res. We’ve whether it’s for plastic bo琀琀les, packaging, or electronics. LEARN MORE added a new Air Quality feature in Google Search and We’re also engaging with individuals on climate and other Maps that shows the air quality conditions for the day, environmental topics via YouTube. On Ea爀琀h Day 2022, Pre-owned items • Empowering with technology whether it’s unusually smoggy or dangerously smoky. we launched a Non-Fungible Planet campaign, where we • Google Maps eco-friendly routing Available in cities in the U.S., Singapore, Brazil, and Chile, teamed up with environmental non-pro昀椀ts, creators, and Global search interest in “slow fashion” reached among other locations, this data can help people consider other organizations to show what makes Ea爀琀h so special • Searching for sustainability with Google a 15-year high in 2022. 46 And global searches for their activities for the day, including whether to stay and wo爀琀h protecting. They journeyed to one-of-a-kind “thri昀琀ing” have nearly tripled over the most recent • Suppo爀琀ing a clean energy future with Nest Renew indoors. locales and created videos to highlight the stress our three-year period compared to the previous three-year environment is under and what we can do to help. In 2022, • The search for sustainability 47 48 Google Maps and Waze both suppo爀琀 user ale爀琀s for period, reaching a 15-year high in 2022. The apparel YouTube also held our 昀椀rst ever Creators for Climate Action clean air zones. A clean air zone is a designated summits, one in New York and one with TED Countdown industry is responsible for nearly 7% of global carbon emissions, so clothing choices have a big impact on urban area with high air pollution where measures are in London. 49 reducing both waste and emissions. implemented to improve air quality, such as charging an entry fee to drivers of high-emissions vehicles. If a To stay safe during extreme weather events, people o昀琀en Buying pre-owned items is a small action people can route crosses a clean air zone, the driver will be ale爀琀ed to turn to the internet with questions. For example, global take to live more sustainably. In 2022, we launched add a permit if they own one, then eligible routes will be search interest in “heat waves” reached an all-time enhancements to the Google Shopping experience in suggested for them based on that pass. 44 high in July 2022. To su爀昀ace authoritative and helpful the United States for pre-owned products, such as used information in these moments, we’re providing information and refurbished products. through Search ale爀琀s on 昀氀ooding, wild昀椀re boundaries, and extreme heat. More details on how AI enables these ale爀琀s can be found in the Working together section. 19
Introduction Empowering individuals Working together Operating sustainably Governance and engagement Appendix 2023 Environmental Repo爀琀 Working Our ambition Our approach together Suppo爀琀ing pa爀琀ners Investing in breakthrough innovation We’re working together with our Creating ecosystems for collaboration pa爀琀ners and customers to advance technology for sustainability The journey ahead 20
Introduction Empowering individuals Working together Operating sustainably Governance and engagement Appendix 2023 Environmental Repo爀琀 Data most e昀케cient in the world and sourcing more carbon-free change, and we see exciting oppo爀琀unities for fu爀琀her Our ambition energy. This enables others to expand their use of digital impact. AI is embedded into many of our sustainability technologies in a more sustainable way, by monitoring and initiatives—including detecting and forecasting 昀氀oods and To e昀昀ectively mitigate and adapt to climate change and optimizing cloud-related emissions, and choosing cleaner wild昀椀res, helping people and cities adapt to extreme heat, protect ecosystems, organizations need a data-driven regions in which to run their workloads. and protecting critical species habitat. We believe that Google has a unique understanding of their impacts. Currently, much of this data is fragmented across thousands of silos and a multitude oppo爀琀unity that extends beyond reducing AI We’re leveraging this unique suite of capabilities in three key the environmental impacts of our own of databases. To help solve this problem, we’ve curated a ways: suppo爀琀ing pa爀琀ners, investing in breakthrough operations and value chain. By organizing large catalog of Ea爀琀h observation datasets in the Ea爀琀h innovation, and creating ecosystems for collaboration. As an AI-昀椀rst company, we’ve established a track record of Engine Data Catalog. We created Environmental Insights information about our planet and making applying AI to some of the most signi昀椀cant challenges facing Explorer, which empowers thousands of cities and regions it actionable through technology and humanity, such as environmental degradation and climate with actionable data and insights to reduce global emissions. More recently, we also built Data Commons, an open- pla琀昀orms, we can help pa爀琀ners and customers create even more positive impact. source tool to organize hundreds of public sustainability datasets into a single, accessible resource. Digital technologies play a critical role in industry Geospatial technology transitions, allowing us to measure and track sustainability progress, optimize the use of resources, reduce Google has made deep investments over nearly two greenhouse gas emissions, and enable a more circular 50 decades in geospatial technology and pla琀昀orms such economy. Cloud computing and digital technologies as Google Maps and Google Ea爀琀h. Google Ea爀琀h Engine underpin the transformation in many sectors, such as is a leading technology pla琀昀orm for planetary-scale energy, transpo爀琀ation, and agriculture. Research that environmental monitoring that was launched in 2010 we commissioned in 2022 found that 20%–25% of what’s for scientists and NGOs. In 2022, it was expanded for required for the EU’s 2050 net-zero goal requires some 51 commercial use by businesses and governments as so爀琀 of digital enablement. an enterprise-grade service through Google Cloud. Researchers from academic institutions, NGOs, and Our approach intergovernmental organizations have leveraged and built upon our tools for a wide variety of use cases from measuring habitat ranges to protecting forest and ocean ecosystems. By combining Google’s suite of unique capabilities in data, geospatial analytics, cloud computing, and AI, Cloud we’re enabling our pa爀琀ners and customers to advance sustainability goals. Google Cloud is helping to transform a number of carbon- emi琀琀ing sectors, such as energy, transpo爀琀ation, and Governments, aid organizations, and individuals can use Flood Hub to take timely action and prepare for riverine 昀氀oods, agriculture. We’ve made signi昀椀cant investments in cleaner seeing locally relevant 昀氀ood data and forecasts up to 7 days in advance. cloud computing by making our data centers among the 21
Introduction Empowering individuals Working together Operating sustainably Governance and engagement Appendix 2023 Environmental Repo爀琀 emissions accounted for almost 23% of total city emissions cooler environments. As of March 2023, we expanded our 54 in 2018. Izmir is using EIE to assess the e昀昀ectiveness of coverage to more than 350 cities on four continents. For Suppo爀琀ing pa爀琀ners GHG emissions mitigation actions and apply them to policy example, the city of Austin has used the EIE Tree Canopy and decision-making to align with the goals de昀椀ned in the tool to prioritize planting trees in vulnerable areas and help city’s Sustainable Energy and Climate Action Plan. place bus shelters to increase shade. We’re building pa爀琀nerships to advance sustainability strategies to reduce emissions, and adapt to climate goals through technology across three key groups: change impacts. EIE is suppo爀琀ed and o昀昀ered to cities Tree canopy coverage governments and intergovernmental organizations; for validation by leading city networks including the customers and commercial pa爀琀ners; and researchers, Global Covenant of Mayors for Climate & Energy (GCoM), Tree Canopy Insights uses AI and aerial EIE also provides Tree Canopy Insights, which uses imagery to detect and map tree canopy academics, and NGOs. C40 Cities Climate Leadership Group, ICLEI, and others. AI and aerial imagery to detect and map tree canopy coverage in cities. coverage in cities (see Figure 7) to help them create EIE makes actionable climate data available to more than Governments and 40,000 cities and regions worldwide. Over a thousand intergovernmental cities globally have signed up to view their data and use the insights for their GHG inventories and climate FIGURE 7 organizations action planning. For example, Iniciativa Climática de EIE Tree Canopy Insights México is working with city o昀케cials to evaluate Mexico City’s building emissions and the potential to generate We’re creating tools to help governments and renewable energy from roo昀琀op solar, using data from EIE, intergovernmental organizations make decisions on key and suppo爀琀 from Google.org and ICLEI. topics—such as urban infrastructure, transpo爀琀ation systems, regulations, and investments—that have a signi昀椀cant, long-term impact on people and our planet. Building emissions Cities and urban areas are a pa爀琀icular focus for our work, since they’re home to a large propo爀琀ion of the global In 2022, EIE released building emissions data for 4,000 new population and produce a signi昀椀cant amount of GHG cities, bringing our total buildings data coverage to over emissions. More than half the world’s population now lives 13,000 cities worldwide. We’ve substantially increased our in urban areas, with this number expected to grow to 68% geographic coverage of the world, improving it by over 52 by 2050, and cities account for 70% of energy-related 250%—from just over 9.5 million square kilometers to over 53 carbon dioxide emissions globally. 35 million square kilometers—resulting in over 50% more buildings counted and 40% more building 昀氀oor area used to estimate emissions. Environmental Insights Explorer Transpo爀琀ation emissions Google created Environmental Insights Explorer (EIE) with Using anonymized tra昀케c pa琀琀erns and other geospatial and for cities and regions. This freely available online tool information, EIE is also able to estimate transpo爀琀ation brings many of our technological advancements together emissions for trips within a city’s boundary. For example, to help measure emission sources, analyze data, identify in Izmir, Turkey’s third most populous city, transpo爀琀ation 22
Introduction Empowering individuals Working together Operating sustainably Governance and engagement Appendix 2023 Environmental Repo爀琀 Air quality Flood forecasting approaches that use machine learning to create scalable models in real-world se琀琀ings. We’re exploring how AI and aerial 58 Google has worked with several cities to capture imagery can be used to help cities and Annually, 昀氀oods cause thousands of fatalities worldwide, governments address “heat islands” In May 2023, we expanded coverage to territories in 60 new hyperlocal air quality insights used to help improve the disrupt the lives of millions, and cause signi昀椀cant 昀椀nancial by implementing cool roofs in countries across Africa, the Asia-Paci昀椀c region, lives and health of residents. We pa爀琀nered with Dublin damages. relevant locations. City Council to map air quality street-by-street using an electric Street View car, to increase awareness of air Our Flood Forecasting Initiative, launched in 2018, uses quality levels and help implement sma爀琀 transpo爀琀ation AI to predict when and where riverine 昀氀ooding will occur, We’re applying AI and working with 昀椀re policies. We also pa爀琀nered with New York state to helping to keep people safe and informed. Our Flood Hub authorities to detect, track, and predict Adaptation suppo爀琀 for launch a statewide air quality and greenhouse gas pla琀昀orm now displays 昀氀ood forecasts to help governments, wild昀椀res, and to help authorities respond mobile monitoring initiative in areas overburdened by aid organizations, and at-risk communities take timely action. be琀琀er to new wild昀椀re threats. communities environmental pollution. These breakthroughs are a result of innovative modeling As climate change increases extreme weather events around the world, we’re also helping communities adapt Road tra昀케c to environmental changes and stay one step ahead of natural disasters. We also know that many cities su昀昀er from urban road tra昀케c, which wastes fuel and creates harmful air pollution. That’s why we created Green Light, an AI tool that Wild昀椀re detection and prediction measures driving trends at intersections and develops recommendations that city tra昀케c engineers can use to Climate change is increasing the frequency and severity optimize the timing of light changes to reduce stop-and- of wild昀椀res, which are having a devastating impact on 56 go tra昀케c. Our recent tests in Hamburg, Germany showed communities and ecosystems around the world. To that at tra昀케c lights with our AI-driven recommendations, minimize the impact of wild昀椀res on communities, Google has cars made over 25% fewer stops, resulting in developed a new AI-based technology to map wild昀椀res in 55 approximately 10% fewer emissions at intersections. near real time. It uses data from geostationary satellites such as NOAA’s GOES constellation to show the size of a wild昀椀re, with data being refreshed roughly every 15–20 minutes. Cool roofs Additionally, we’re collaborating with the USFS on wild昀椀re research by using advanced simulation and AI techniques to Cool roofs are designed to re昀氀ect sunlight and absorb less 57 accelerate their 昀椀re spread model. heat, and they’re especially impac琀昀ul in communities that may not have access to reliable air conditioning. We’re We’ve also been working closely with U.S. agencies, such exploring how our technology—such as AI algorithms and as the U.S. Forest Service (USFS). USFS used Google Ea爀琀h aerial imagery—can help more places implement cool Engine and Google Cloud technology to build a Landscape roofs. We’re able to map out the solar re昀氀ectivity of cities Change Monitoring System to map and monitor land cover so urban planners and governments can identify what From wild昀椀re mapping, to ea爀琀hquake detection and ale爀琀s to 昀氀ood forecasting, we continue to 昀椀nd new ways for technology change across the United States and suppo爀琀 forest planning areas would bene昀椀t most from cool roofs. We’ll soon to be helpful at the most critical times. and post-昀椀re recovery. begin piloting this tool with select cities. 23
Introduction Empowering individuals Working together Operating sustainably Governance and engagement Appendix 2023 Environmental Repo爀琀 Europe, and South and Central America. Flood Hub now Water security FIGURE 8 displays forecasts for 80 countries. This includes some of Freshwater Ecosystems Explorer the territories with the highest percentages of population We’re pu琀琀ing Google’s products and technology in The Freshwater Ecosystems Explorer helps to quantify and visualize su爀昀ace water changes. exposed to 昀氀ood risk and experiencing more extreme service of helping others to study and respond to water weather, covering 460 million people globally. All forecasts security challenges. Improving water security requires an are displayed for free. accurate accounting of freshwater resources and how they change over time. As an example, we pa爀琀nered with the United Nations We’re applying advanced machine learning Environment Programme (UNEP) and the European methods to forecast when and where riverine Commission’s Joint Research Centre to develop the 昀氀oods may occur, up to seven days in advance, Freshwater Ecosystems Explorer. Following the launch of helping to save lives and livelihoods. the Sustainable Development Goals, UNEP requested that all 193 member states provide indicator 6.6.1 data on the 59 extent of their water-related ecosystems. At that time, the majority of member states couldn’t repo爀琀 on this Risk to infrastructure and natural resources metric. To 昀椀ll this gap, the Freshwater Ecosystems Explorer (sdg661.app) helps to quantify and visualize su爀昀ace water changes over the course of decades. This free, In 2022, we announced our Google Cloud climate insights easy-to-use geospatial pla琀昀orm and data product helps o昀昀erings to help government agencies be琀琀er understand decision-makers access national, sub-national, and basin- the risks to infrastructure and natural resources due to level data on freshwater ecosystems (see Figure 8). climate change. In addition to other water ou琀昀lows, freshwater is For example, we pa爀琀nered with the State of Hawaii transferred to the atmosphere via evapotranspiration. Depa爀琀ment of Transpo爀琀ation (HDOT), which manages Together with government and academic research 2,500 miles of highway—much of which is facing risks due groups and the nonpro昀椀t OpenET, Google has helped to erosion and sea level rise. HDOT is leveraging Google improve water management by suppo爀琀ing the Ea爀琀h Engine and other Google Cloud services for its Climate Resilience Pla琀昀orm, using big data and insights automation and scaling of evapotranspiration (ET) models. These models provide estimates of how much to assess risk and prioritize investment decisions based water is transferred from the land to the atmosphere, a on multiple climate risks, asset conditions, and community crucial but di昀케cult to measure process within the overall impact. hydrological cycle. Now OpenET is making satellite-based ET data widely accessible to farmers, landowners, and water managers. 24
Introduction Empowering individuals Working together Operating sustainably Governance and engagement Appendix 2023 Environmental Repo爀琀 forests, water cycles, and biodiversity that intersect Cloud customers and Climate risk and resilience Renewable energy its supply chain. We also helped launch TraceMark, a Google Cloud Ready – Sustainability Solution designed commercial pa爀琀ners Many of our commercial customers are eager to Wind farms are an impo爀琀ant source of carbon-free for enterprises, which aims to accelerate the delivery of assess and improve their resilience to climate change. electricity, but wind can 昀氀uctuate depending on the traceability and transparency in global supply chains for We’re collaborating with customers and commercial From transpo爀琀ation companies to 昀椀nancial service weather. Through Google Cloud, customers like Engie raw materials. pa爀琀ners across a number of sectors—including energy, organizations, Google is helping organizations integrate (a global energy and renewables supplier) can optimize transpo爀琀ation, agriculture, manufacturing, consumer climate data and geospatial analysis into business strategy their wind po爀琀folio in sho爀琀-term power markets goods, and 昀椀nancial services—to work towards and risk management. For example, we pa爀琀nered with by predicting wind power output 36 hours ahead of Transpo爀琀ation-related sustainability goals. RSMetrics and Infosys to publish a design pa琀琀ern for actual generation and making optimal hourly delivery emissions po爀琀folio climate risk analysis and we’re helping insurers commitments to the grid, a full day in advance. We’re providing powe爀昀ul insights to help our Google boost responses to disaster-related claims. We’re working with a number of commercial organizations Cloud customers around the world predict climate risk, to tackle transpo爀琀ation-related emissions. Ecommerce increase visibility across their supply chain, and reduce Sustainability pa爀琀ner We’ve launched SpatiaFi, together with our pa爀琀ner 60 shipments are on track to double by 2026, and 90% of and repo爀琀 on their emissions. Climate Engine, to help the banking sector harness the solutions U.S. consumers expect free two-to-three-day shipping, 61 power of geospatial analytics to suppo爀琀 climate 昀椀nance. so we’re helping businesses optimize every stage of the For example, geospatial data can help a bank’s agriculture Pa爀琀ner solutions are impo爀琀ant to scale the impact for our Carbon footprinting last mile delivery journey: capturing valid addresses, customers build a personalized picture of 昀氀ood and customers and help them get the suppo爀琀 they need, from optimizing delivery routes, e昀케ciently navigating drought risks and biodiversity at a 昀椀eld-speci昀椀c level. processing ESG data to reducing carbon emissions. This is In 2022, we introduced the Carbon Sense Suite, which drivers, tracking shipment progress, and analyzing 昀氀eet why we launched Google Cloud Ready – Sustainability, a includes products such as Carbon Footprint and Active pe爀昀ormance. We’re also helping organizations harness designation to validate and promote sustainability pa爀琀ner Assist, and tools such as Cloud region picker. The suite is the power of data and AI to drive more intelligent logistics Responsible sourcing solutions built on Google Cloud. enabling Google Cloud customers to accurately measure, operations and supply chains. For example, our customer repo爀琀, and reduce their cloud-related carbon emissions. EV Suitability Assessment helps organizations monitor As global demand for raw materials continues to grow, We help developers and organizations make low-carbon their 昀氀eet of vehicles and make choices that minimize deforestation is increasing, contributing to GHG emissions. architecture decisions and provide best practices to environmental impact. Companies want to know more about the origins of their improve sustainability. raw materials, including which are sourced responsibly— Data analytics tools from Google Cloud are also helping and how they can improve their sourcing practices. Developers at companies such as L’Oréal and SAP are airlines. Lu昀琀hansa Group pa爀琀nered with Google Cloud using Google Cloud tools to reduce the emissions and Google Research to develop a pla琀昀orm that facilitates Google Cloud, in pa爀琀nership with NGIS (a geospatial associated with their technology footprint. Working be琀琀er planning and management of daily 昀氀ight operations. solutions company) is helping brands gain a deeper closely with these customers, we developed our Carbon understanding of sustainable sourcing practices across Footprint product—a freely available tool that provides supplier networks. By combining the power of our cloud monthly emissions data on a per service, project, and computing, AI, and geospatial analytics, we’re helping We’re helping organizations harness region basis. The data can be accessed in BigQuery for companies get real-time, reliable information into the power of data and AI to drive more analysis and can be easily integrated with popular carbon operations at a local supplier level, globally. For example, intelligent supply chains. accounting tools. Carbon Footprint data is also integrated Great Western wind farm in Oklahoma we’re helping Unilever build a more holistic view of the with recommendations to reduce emissions. (225 MW for Google) 25
Introduction Empowering individuals Working together Operating sustainably Governance and engagement Appendix 2023 Environmental Repo爀琀 Researchers, academics, In 2022, researchers addressed urban climate change FIGURE 9 inequities using publicly available data from Ea爀琀h Engine. Glacier retreat in Sermersooq, Greenland, seen from Timelapse in Google Ea爀琀h. and NGOs This study used Ea爀琀h Engine to combine medium-to-high- resolution satellite observations with census data to calculate the feasible area available for planting new trees in urban We’re providing cu琀琀ing-edge climate- and nature-related 62 areas for over 200 areas in California. By quantifying this, data and analytics to scienti昀椀c researchers from academic 1984 they were able to provide estimates of several co-bene昀椀t institutions and NGOs. This suppo爀琀 is enabling advances of tree cover. in the most complex areas of their 昀椀elds, applying AI, machine learning, and geospatial analytics at a global scale to accelerate the shi昀琀 to a sustainable future. To accelerate the innovation that we’ve seen from the scienti昀椀c and NGO communities, we’re now bringing Google Ea爀琀h Engine to public and private sector users. Planetary-scale pla琀昀orms In 2022, we expanded Google Ea爀琀h Engine’s availability for commercial use by businesses and governments worldwide Launched in 2010, Google Ea爀琀h Engine is Google’s as an enterprise-grade service through Google Cloud. planetary-scale pla琀昀orm for Ea爀琀h science data and With access to reliable, up-to-date insights on how our analysis. It o昀昀ers over 1,000 Ea爀琀h observation datasets with planet is changing, organizations will be be琀琀er equipped powe爀昀ul cloud computing to show timely, accurate, high- to move their sustainability e昀昀o爀琀s forward. resolution insights about the state of the world’s habitats and ecosystems—and how they’re changing over time. Google Ea爀琀h Scientists, researchers, and developers have been using Our planet has seen rapid environmental change in the past Ea爀琀h Engine for more than a decade to detect changes, half-century—more than at any other point in human history. map trends, and quantify di昀昀erences on the Ea爀琀h’s su爀昀ace. 2022 In 2022, over 90,000 users regularly used Ea爀琀h Engine’s Timelapse in Google Ea爀琀h is a global, zoomable data analytics and computing for research and educational time-lapse video of the planet, providing a clearer picture purposes. Multiple global conservation and restoration tools of Ea爀琀h’s dynamic change since 1984—not just problems, have also been built on the pla琀昀orm. For example, founded but also solutions, as well as beautiful natural phenomena by Crowther Lab in Zurich and powered by Google Ea爀琀h that unfold over decades—from irrigation systems Engine and Google Cloud, Restor allows anyone to analyze emerging in the dese爀琀s of Egypt to volcanic eruptions, the restoration potential of any place on Ea爀琀h. When you logging, and wild昀椀res changing the landscape of outline a given area on the Restor map, it will show you California’s Lassen National Forest and glaciers retreating data on local biodiversity, the current and potential amount in Sermersooq, Greenland (see Figure 9). of solid carbon stored in the soil, land cover, soil pH, and annual rainfall. With this information, the pla琀昀orm connects The imagery also captures how cities have adapted practitioners, facilitates the exchange of information, and to combat climate change—like o昀昀shore wind farms makes projects visible to potential funders and the public. in Middelgrunden, Denmark and a large-scale solar installation in Granada, Spain. 26
Introduction Empowering individuals Working together Operating sustainably Governance and engagement Appendix 2023 Environmental Repo爀琀 Natural disasters the highest levels of food insecurity. They can then map out Data Commons speci昀椀c food suppo爀琀 sites to see which counties will need We’re working with pa爀琀ners to leverage more civil society organizations helping with food insecurity. machine learning to monitor and protect Pa爀琀nering with the John Doerr School of Climate at Sustainability data is fragmented across thousands of silos, wildlife habitats, such as coral reefs. Stanford, Data Commons has helped Stanford create in many formats and schemas, and across a multitude of databases. In 2017, we sta爀琀ed the Data Commons a climate disaster dashboard to identify areas a昀昀ected Wildlife monitoring by wild昀椀res, wet bulb temperatures, and other natural project, which aggregates data from a wide range of disasters exacerbated by climate change. The Data sources into a uni昀椀ed database to make it more accessible In 2022, global search interest in “wildlife” nearly Commons team was able to take numerous climate models and useful. Data Commons was developed by Google to 63 64 tripled, reaching a 15-year high. We’re using our and model probabilities for future temperature ranges in organize sustainability data from hundreds of sources, technology to suppo爀琀 wildlife conservation e昀昀o爀琀s around speci昀椀c areas. such as the World Bank, National Aeronautics and Space the world. TerrAdapt uses satellite monitoring technology Administration, and the U.S. Centers for Disease Control Water quality powered by Google Ea爀琀h Engine to project habitat and Prevention (CDC). It makes this data available to conditions given future climate and land-use scenarios. researchers, journalists, policymakers, individuals, and TerrAdapt can help prioritize areas for conservation Data Commons is helping communities get a be琀琀er other stakeholders around the globe. actions—like habitat restoration, increasing protection understanding of water use, quality, and availability. For status, and building wildlife crossings. example, a researcher at the Indian Institute of Technology Today, Data Commons is one of the world’s largest Madras is working with Data Commons to add India-based knowledge graphs on sustainability, including data about Google teamed up with the Commonwealth Scienti昀椀c data on water quality. climate, health, food, crops, shelter, emissions, and more. and Industrial Research Organisation (CSIRO—Australia’s Anyone can access, explore, and understand this data using national science agency) and the Kaggle data science Google Search or our free dashboards and visualization Food security community to protect coral reefs including Australia’s tools, and they can use our open and free APIs to build Great Barrier Reef, the world’s biggest coral reef system. new tools based on this data. For enterprise customers, Feeding America is a nationwide network of 200 member We developed a machine learning solution to analyze this data is available via Data Commons on the BigQuery food banks serving tens of millions of people in need in the underwater images of a species of sta爀昀ish that feed Analytics Hub. United States. Data from their annual Map the Meal Gap on living coral. By detecting them more accurately and study is accessible in Feeding America Data Commons, so e昀케ciently, scientists can now more easily monitor the reef Data Commons is being used to monitor and address a anyone can explore food security and how it intersects with and manage the impact of the sta爀昀ish more e昀昀ectively. variety of sustainability challenges, including climate change, variables like health, climate, and education. For example, In collaboration with CSIRO and other pa爀琀ners, we’re also natural disasters, water quality, and food security. it shows that counties that will be most a昀昀ected by climate applying AI to measure carbon sequestration capacity of change are also already most a昀昀ected by food scarcity. seagrass ecosystems. Climate change This data allows Feeding America to quickly identify U.S. locations where food insecurity is most exacerbated by Since 2017, Google has been a founding technology other root causes of disparities and hardship. Data Commons can ingest health data from the CDC and pa爀琀ner in Wildlife Insights—a collaboration between climate data from the IPCC, and combine them by aligning seven leading conservation organizations to streamline Nonpro昀椀t TechSoup used Data Commons to identify how data on location, health conditions, or dates. A policymaker biodiversity monitoring with the help of AI and to 昀椀ll critical climate change will impact food security needs in California. can then use Data Commons to compare these two datasets data gaps to inform data-driven decisions. This pla琀昀orm Wildlife Insights helps conservationists protect species This allowed them to see that agricultural counties that will to identify outliers and understand how temperature changes makes it easier for conservationists and scientists to collect from extinction with AI. be most impacted by temperature changes are already at may a昀昀ect populations with pre-existing conditions. and analyze data from remote cameras. 27
Introduction Empowering individuals Working together Operating sustainably Governance and engagement Appendix 2023 Environmental Repo爀琀 Investing in breakthrough innovation Sustainable food Mineral is using robotics, AI, and computer vision to create a more systems sustainable food production system. food production system. It’s developing perception- Increasing agricultural productivity and sustainability We’re helping advance the next generation of audacious Ocean ecosystems powered solutions with pa爀琀ners across the agriculture is imperative to feed the planet’s growing population. technologies to address sustainability challenges. value chain—from grocery retailers and enterprise Incubating breakthrough technologies is essential for Modern agriculture has a signi昀椀cant environmental Tidal is X’s moonshot to protect the ocean with farms to equipment manufacturers and crop protection impact, such as soil degradation and biodiversity loss the transformative change needed to deliver deep technology systems while feeding humanity sustainably. companies—to develop a be琀琀er understanding of the emissions reductions at scale and to bend the curve due to weeds, pests, diseases, herbicide resistance, and Its underwater sensor system and machine perception excess chemical input waste. Mineral uses robotics, complex interactions of plants, their growing environment, of climate change. tools are bringing visibility to our ocean ecosystems so we and farm management practices. AI, and computer vision to create a more sustainable can be琀琀er understand and protect them while sustainably And at X, Alphabet’s “moonshot factory,” our teams are harnessing the ocean to solve some of humanity’s biggest developing cu琀琀ing-edge technology that aims to solve challenges—from food production to climate change. problems for millions of people and change systems worldwide. Climate-related projects comprise more than Tidal’s 昀椀rst product monitors 昀椀sh and environmental half of X’s current moonshots, which include experiments conditions underwater to detect and interpret things in ocean health, carbon sequestration, clean energy, like 昀椀sh behaviors, which are helpful for feeding and wild昀椀re awareness, waste reduction, and sustainable health tracking, and predict outcomes such as growth agriculture. X is using what they’ve learned from a decade trends over time—all of which can help 昀椀sh farmers make of climate projects to shape the work they’re doing now. be琀琀er, more environmentally-friendly and cost-e昀昀ective decisions about 昀椀sh feeding, welfare, and health. Clean electricity Tapestry aims to unlock access to clean, reliable, and Autonomous driving a昀昀ordable electricity worldwide by providing greater Waymo’s mission is to make it safe and easy for people insight into our increasingly dynamic and complex and things to get where they’re going. Waymo’s 昀氀eet of electricity system. As X’s moonshot for the electric grid, shared electric vehicles provides a fully autonomous ride- it’s creating a single vi爀琀ualized view of the electricity hailing service in Phoenix and San Francisco, connecting system that can predict and simulate what might happen communities with the bene昀椀ts of EVs. Waymo’s EV 昀氀eet is on the grid from nanoseconds to decades into the also matched with 100% renewable electricity. future. Insights from such computational models can lead to reduced energy consumption, lower emissions, and improved resilience to outages, as well as reduce interconnection queues, enabling more renewable energy capacity to be added to the grid. Tidal testing its technology at a 昀椀sh farm no爀琀h of the Arctic Circle. 28
Introduction Empowering individuals Working together Operating sustainably Governance and engagement Appendix 2023 Environmental Repo爀琀 Creating ecosystems for collaboration Beyond our own tools and programs, we continue to Examples of other sustainability-focused investments invest in promising initiatives that aim to create scalable, include: high-impact collaboration ecosystems for climate change and sustainability. • AI for the Global Goals, $25 million in funding to suppo爀琀 the development of new AI-driven approaches that accelerate progress on the Google.org UN Sustainable Development Goals. • A $10 million grant to ICLEI-Local Governments for Google.org aims to bring the best of Google to help solve Sustainability to suppo爀琀 10 nonpro昀椀t-led projects some of humanity’s biggest challenges. This includes that help cities accelerate their sustainable transition combining funding, innovation, and technical expe爀琀ise to through data-driven environmental and climate action suppo爀琀 underserved communities, provide oppo爀琀unity at the local level. for everyone, and help address a number of sustainability The Environmental Justice Data Fund, a collection challenges. • of grants totaling nearly $9 million that aim to help Launched in 2022, the Google.org Impact Challenge on frontline communities that have been historically Climate Innovation allocates up to $30 million to suppo爀琀 underserved and dispropo爀琀ionately impacted by climate change and environmental injustice. breakthrough projects that use data and technology to accelerate climate action. Selected organizations will • AVPN’s APAC Sustainability Seed Fund provides receive funding to scale their activities, along with access $3 million in grant funding to 13 local organizations to Google’s technical expe爀琀ise and products to help focused on sustainability solutions for vulnerable and them maximize their impact. Our 昀椀rst recipient, the World underserved communities in Asia Paci昀椀c. Resources Institute (WRI), will receive $5 million to suppo爀琀 its project, which will use sensors, satellite imagery, and AI to help decision-makers understand where to implement cool su爀昀ace infrastructure to reduce the impact of extreme heat. We’ve launched the Google.org Impact Challenge: Tech for Social Good—the 昀椀rst open call for European organizations to apply for pro bono technical suppo爀琀 and funding for charitable projects focused on tackling Googlers collaborate in the Event Center at our Bay View campus. complex issues, including sustainability. 29
Introduction Empowering individuals Working together Operating sustainably Governance and engagement Appendix 2023 Environmental Repo爀琀 • Google for Sta爀琀ups Accelerator: Circular Google for Sta爀琀ups Economy: Launched in 2022, this new program focuses on suppo爀琀ing sta爀琀ups and nonpro昀椀ts in By investing early in technologies aimed at tackling No爀琀h America and Asia Paci昀椀c working on challenges sustainability challenges like climate change, we have related to advancing a more circular economy—from the potential to move the needle on sustainability and food waste to fashion, recycling, and reuse—with positively impact our planet. We have a po爀琀folio of technical solutions. sustainability-focused accelerators, which suppo爀琀 early stage innovations to grow and scale. Sta爀琀ups for Sustainable Development Google for Sta爀琀ups Through our Sta爀琀ups for Sustainable Development Accelerator program, we’re working with impact-driven sta爀琀ups using technology to build a more sustainable future. All are on a Google for Sta爀琀ups is working to identify, suppo爀琀, and mission to address one or more of the U.N.’s 17 Sustainable scale sta爀琀ups that are building technologies to combat Development Goals, from eradicating pove爀琀y and hunger climate change and build a more circular economy. These to improving healthcare and advancing climate action. accelerators are 10-week programs for Seed to Series We provide them with long-term suppo爀琀 to scale their A technology sta爀琀ups, designed to bring the best of The Google.org Impact Challenge on Climate Innovation suppo爀琀s breakthrough projects that use data and technology to impact: mentoring from expe爀琀 advisors, connections to Google’s programs, products, people, and technology accelerate climate action. funding pa爀琀ners, and access to cu琀琀ing-edge research to some of the most innovative and impac琀昀ul climate and technology. The program now suppo爀琀s nearly 400 change and circular economy technologists. In addition to sta爀琀ups in over 60 countries, working with a network of mentorship and technical project suppo爀琀, the accelerator over 140 pa爀琀ner organizations. focuses on product design, customer acquisition, and The journey ahead leadership development for founders. 2022 HIGHLIGHT From measuring and monitoring changes on the Ea爀琀h’s LEARN MORE • Google for Sta爀琀ups Accelerator: Climate Change: su爀昀ace, improving forecast and prediction models for Since launching the program in 2021, we’ve hosted • Data Commons Our Sta爀琀ups for Sustainable 昀氀ooding and wild昀椀res, optimizing operations, combining four climate accelerators, each with a distinct Development program now suppo爀琀s disparate data sources, and designing more e昀케cient • Environmental Insights Explorer geographic focus. The 昀椀rst three coho爀琀s included 33 products, we continue to leverage our expe爀琀ise in nearly 400 sta爀琀ups in over 60 sta爀琀ups in No爀琀h America that repo爀琀 they’ve raised • Google Cloud sustainability technology and apply the latest advancements to help over $650 million in funding. We also announced the countries working with a network solve global challenges. • Google Ea爀琀h Engine expansion of this program to Europe, in pa爀琀nership of over 140 pa爀琀ner organizations. with Google Cloud, where we worked closely to • Sustainability-focused accelerators We believe that by working together with our pa爀琀ners and accelerate 13 climate tech companies from the sub customers, we can make a real di昀昀erence in addressing the sectors of Agtech, SaaS, 昀椀ntech, real estate, supply challenges of climate change and ecosystem degradation. chain, and circular economy. 30
Introduction Empowering individuals Working together Operating sustainably Governance and engagement Appendix 2023 Environmental Repo爀琀 Our ambition Operating Our operations sustainably Net-zero carbon Water stewardship Circular economy We’re showing the way forward Nature and biodiversity through our own operations Spotlight: Building a more sustainable campus in Mountain View 31
Introduction Empowering individuals Working together Operating sustainably Governance and engagement Appendix 2023 Environmental Repo爀琀 Our Our ambition operations Google uses energy, natural resources, and products Our work on sustainability sta爀琀ed with our own operations, and we’ve worked hard and services to build our workplaces, data centers, and to lead by example, with the ultimate goal consumer hardware products. At the end of 2022, we had of driving larger systems change. We set o昀케ces and data centers in roughly 200 cities and nearly 60 countries around the world. We also had two retail ambitious sustainability goals. We share the stores, both in New York City. innovations we create and the lessons we learn with others, so we can help accelerate The products and services that our customers and users the global transition to a low-carbon and rely on—like Gmail, Google Cloud, Search, and YouTube— sustainable future. are powered by our data centers and networking infrastructure. At the end of 2022, we had 28 Google- owned and -operated data center campuses across 24 We’re working to drive sustainability across our operations 65 data center locations on four continents, as well as more in four key ways: accelerating the transition to a net-zero than 30 Google Cloud regions. In addition to our Google- carbon future, advancing water stewardship, building a owned and -operated data centers, we use additional circular economy, and protecting nature and biodiversity. third-pa爀琀y-operated data centers as well. We work worldwide with suppliers that suppo爀琀 our business and operations, including hardware manufacturing and indirect services. Through our Supplier Responsibility program, we collaborate with stakeholders across our supply chain to uphold our high standards for protecting workers and the environment. Google’s data center in St. Ghislain, Belgium. 32
Introduction Empowering individuals Working together Operating sustainably Governance and engagement Appendix 2023 Environmental Repo爀琀 Our ambition The United Nations Intergovernmental Panel operate our data centers and o昀케ce campuses on 24/7 on Climate Change is unequivocal: climate carbon-free energy on every grid where we operate by change is an urgent threat to human 2030 (24/7 CFE). We’ve been working hard to transition our operations and the electricity grids that serve us to cleaner well-being and the health of the planet. 66 sources of power, through a combination of clean energy While the last several years have seen procurement, technology innovation, and policy advocacy. signi昀椀cant progress in mobilizing the global And we expect our work to decarbonize electricity grids community to take more ambitious climate where we operate to contribute to decarbonization across action, the world isn’t on track to meet the our value chain as well. targets established by the Paris Agreement Cha爀琀ing our path 67 to limit temperature rise to 1.5°C. Our ambition Achieving net-zero emissions and 24/7 CFE by 2030 are At Google, we’re working to accelerate the transition to a extremely ambitious goals—what we call “moonshots.” carbon-free future. We know that our responsibility begins We also know that our path to net-zero emissions won’t Net-zero Our approach with our own carbon footprint, which is why we’ve taken be easy or linear; it may require us to navigate signi昀椀cant signi昀椀cant steps over the past two decades to minimize our unce爀琀ainty and deploy new systems and technologies own emissions. In 2021, we set our most ambitious goal yet: across our business. Some of our plans will take years to Measuring our carbon to achieve net-zero emissions across all of our operations carbon deliver their full results, pa爀琀icularly where they involve and value chain by 2030. To accomplish this, we aim to footprint building new large-scale infrastructure with long lead reduce 50% of our combined Scope 1, Scope 2 (market- times. So as our business continues to evolve, we expect based), and Scope 3 absolute emissions (versus our 2019 our emissions to rise before dropping towards our Reducing carbon emissions baseline) before 2030, and plan to invest in nature-based and We aim to achieve net-zero absolute emissions reduction target. technology-based carbon removal solutions to neutralize emissions across all of our our remaining emissions. We’ve formally commi琀琀ed to Advancing carbon-free energy the Science Based Targets initiative (SBTi) to seek their In our third decade of climate action, we recognize that we can’t achieve our goals alone. Transitioning to a carbon- operations and value chain validation of our absolute emissions reduction target. free future will require stronger government policies and Managing residual emissions pa爀琀nerships with many other organizations, as well as by 2030 One of the key levers for reducing emissions from our new technologies and structural changes to the broader operations is transitioning to clean energy. Energy use The journey ahead systems that serve our operations and value chain, contributes to a signi昀椀cant share of our carbon footprint such as electricity grids and hardware supply chains. due to the electricity needs of our operations—in pa爀琀icular, our data centers. That’s why, in 2020, we set a goal to 33
Introduction Empowering individuals Working together Operating sustainably Governance and engagement Appendix 2023 Environmental Repo爀琀 It will be especially critical for governments around the di昀昀er widely in maturity. In some cases, this limits our world to enact policies that drive rapid technological ability to successfully in昀氀uence them, and to collect and economic transformations, including the full the data needed to accurately estimate our decarbonization of the global energy system. That’s why Scope 3 emissions. Google advocates for stronger clean energy and climate policies, and pa爀琀ners with many other organizations to Availability of carbon-free energy accelerate clean energy and climate progress. We’ve played instrumental roles in se琀琀ing up advocacy organizations, • There are o昀琀en long lead times between our including the Clean Energy Buyers Association (CEBA) in investments and resulting GHG reductions. For the United States, the RE-Source Pla琀昀orm in Europe, and example, with new wind and solar projects, it can the Asia Clean Energy Coalition (ACEC). take years before projects that we contract are constructed and begin to generate clean electricity. To learn more about our public policy and advocacy, • System-level decarbonization is proceeding more No爀琀her O昀昀shore wind farm in Belgium (92 MW for Google) including policy engagement, trade associations, memberships, and pa爀琀nerships, see the Governance slowly than needed in many regions and sectors, and while we aim to accelerate these changes through our and Engagement section. e昀昀o爀琀s and engagement, they aren’t within our control. Our approach Challenges to address Use of carbon removals While we’re excited about our net-zero emissions journey, Our core business involves using data to solve hard There are three main focus areas that make up our • Because the carbon removals sector is in the earliest we recognize that we face many challenges. For example: problems, and our unique strength is combining engineering approach to our net-zero goal: reducing emissions across stage of development, costs are currently high, and skills with an innovative mindset and a global reach. our operations and value chain, advancing carbon-free there are limited volumes of removals available for Growing energy needs 68 energy, and addressing our residual emissions with carbon purchase. removals (see Figure 10). • As we work towards our absolute 50% emissions As we move towards our net-zero goal, the scale of these FIGURE 10 Our net-zero approach reduction target, our business is continuing to evolve challenges will only increase, along with the di昀케culty to meet the needs of a rapidly digitalizing world, and of additional progress. We believe that the urgency of to harness the oppo爀琀unities presented by climate change demands immediate action, and se琀琀ing AI technology. ambitious, near-term targets is a valuable way to focus our e昀昀o爀琀s and drive impo爀琀ant progress across the energy • Our operations and value chain are global and involve a systems and value chains in which we operate. diverse range of industries, which means we must make progress within hard-to-abate sectors and carbon- Carbon reduction Carbon-free energy Carbon removals intensive geographies, such as the Asia Paci昀椀c region. Reduce emissions across our Advance carbon-free energy across Address our residual emissions • We have a large number of di昀昀erent suppliers, both operations and value chain our operations and value chain with carbon removals direct and indirect, each with climate programs that 34
Introduction Empowering individuals Working together Operating sustainably Governance and engagement Appendix 2023 Environmental Repo爀琀 FIGURE 11 Measuring our carbon footprint Our carbon footprint We began calculating our annual carbon footprint in 2006. we’ve procured clean energy to reduce the carbon Every year since 2009, we’ve publicly repo爀琀ed the results emissions from our electricity use: our Scope 2 (location- Scope 1: 91K tCO e to CDP, a global organization that asks companies to based) emissions, which don’t take into account our 2 disclose information on their GHG emissions pe爀昀ormance renewable energy procurement through power purchase and management. agreements (PPAs), represent 51% of our carbon footprint, demonstrating the dramatic emissions reductions that In 2022, our total GHG emissions were approximately we’ve achieved through PPAs. Scope 2 Total emissions: (market-based): 10.2 million metric tons of carbon dioxide equivalent 2.5M tCO e (tCO e), which represents our Scope 1, Scope 2 10.2M tCO e 2 2 2 (market-based), and Scope 3 emissions. In 2022, our total Scope 3 emissions operational emissions were approximately 2.9 million tCO e, where operational emissions represent Scope 1 2 Our Scope 3 emissions are indirect emissions from other Scope 3 (total): and Scope 2 (market-based) emissions, as well as Scope 3 sources in our value chain, such as our suppliers, use of 7.6M tCO2e emissions from business travel and employee commuting, our consumer hardware products, and business travel. including teleworking (see Figure 11). The majority of these emissions come from upstream manufacturing of consumer hardware products, the production of capital goods we have purchased for Scope 1 emissions use in our data centers, and data center construction. A昀琀er accounting for the impact of renewable energy Scope 1 emissions represent 1% of our carbon procurement through PPAs, Scope 3 emissions Scope tCO2e % footprint. Our main sources of Scope 1 emissions include represent 75% of our carbon footprint. Scope 1 91,200 1% transpo爀琀ation (company vehicles and aircra昀琀), fuel use Scope 2 (market-based) 2,492,200 24% from back-up generators, natural gas use, and refrigerant For more information on our GHG emissions, see the Operational leakage in our data centers and o昀케ces. Repo爀琀ing approach and methodology section and our Scope 3 Business travel 211,000 2% emissions: Environmental data tables. 2.95M tCO e Scope 3 Employee commuting (including teleworking) 151,000 2% 2 Scope 2 emissions Scope 3 Capital goods 2,096,000 21% Scope 3 Upstream transpo爀琀ation and distribution 556,000 5% Scope 2 (market-based) emissions represent 24% of our carbon footprint, mainly due to the electricity Scope 3 Other categories 4,586,000 45% demands of our data centers. Scope 2 emissions are Scope 3 (total) 7,600,000 75% thus a key focus of our decarbonization e昀昀o爀琀s, given that we have more direct control over our data centers than Total emissions 10,183,400 100% many other pa爀琀s of our value chain. For over a decade, 35
Introduction Empowering individuals Working together Operating sustainably Governance and engagement Appendix 2023 Environmental Repo爀琀 our data center hardware, as well as the LCAs and LCA In 2022, we repo爀琀ed Scope 2 (location-based) emissions Reducing carbon emissions emission factors used to calculate emissions related to of 8.0 million tCO e, which doesn’t take into account our 2 data center construction. renewable energy procurement, and Scope 2 (market- based) emissions of 2.5 million tCO e. This means that 2 We’re working to reduce our emissions across our Our emissions reduction These changes are re昀氀ected in our repo爀琀ed Scope through our PPAs, in 2022, we achieved a 69% reduction operations and value chain. Key e昀昀o爀琀s include energy- 3 emissions for 昀椀scal year 2022, but not for the prior in our emissions from our electricity use (see Figure 17). e昀케cient and low-carbon facilities, electri昀椀cation, sustainable goal years. Had we not made these changes, we estimate travel and commuting, and supplier engagement. that our repo爀琀ed Scope 3 emissions would have been Since 2011, our carbon intensity per unit of revenue has In 2022, our total GHG emissions were approximately approximately 18% higher, remaining relatively 昀氀at when decreased by 76% while our business grew signi昀椀cantly Clean energy is also critical to reducing emissions across 69 10.2 million tCO e. We revised our Scope 3 methodology compared to the prior year (see Figure 12). over the same period. We continue working to lower 2 our value chain. Procuring carbon-free energy has a to calculate upstream emissions related to consumer the correlation between our business growth and our signi昀椀cant impact on reducing our Scope 2 emissions by hardware manufacturing by moving away from using a Our Scope 2 (market-based) emissions increased by GHG emissions. eliminating emissions associated with our electricity use. spend-based methodology to a Life Cycle Assessment 37%, primarily due to increased data center electricity In addition, a signi昀椀cant share of our Scope 3 emissions (LCA)-based methodology. consumption and a lack of full regional coverage of can be traced back to the electricity grids that power our renewable energy procurement in the United States suppliers and users, so accelerating the decarbonization We also made improvements to the quality of data used and Asia Paci昀椀c regions. of electricity grids is also key to our net-zero goal. For to estimate our emissions associated with manufacturing more information, see the Carbon-free energy section. FIGURE 12 Legend Total emissions TARGET 2022 PROGRESS Annual emissions Business as usual (footprint in absence of PPAs) Estimated di昀昀erence in 2022 total emissions Reduce 50% of our Total GHG emissions: Scope 3 methodology combined Scope 1, 2 10.2 million tCO e* 20M Base year change due to Scope 3 methodology update 2 (market-based), and 3 *Due to a methodology change, we’re not repo爀琀ing absolute GHG emissions a percent progress towards this target for 2022 10M In 2022, our repo爀琀ed total GHG emissions decreased before 2030 due to improvements we made to our Scope 3 accounting methodology, which we haven’t yet applied to prior years. DETAILS Had we not made these methodology changes, Year set: 2021 | Base year: 2019 | Target year: before 2030 2019 2020 2021 2022 we estimate that our repo爀琀ed 2022 Scope 3 emissions Scope: Percent reduction in combined Scope 1, 2 (market-based), and 3 absolute emissions across our 12,528,000 10,322,100 11,371,200 10,183,400 would have been approximately 18% higher, remaining operations and value chain, when compared to a 2019 base year. This represents our operations and value 16,850,600 15,275,800 16,124,300 15,736,600 relatively 昀氀at when compared to 2021. chain, including consumer hardware products. (in metric tonnes of carbon dioxide equivalent [tCOe]) 2 36
Introduction Empowering individuals Working together Operating sustainably Governance and engagement Appendix 2023 Environmental Repo爀琀 that suppo爀琀 the digital economy. As a pa爀琀 of this e昀昀o爀琀, which is projected to have 96% fewer embodied carbon Energy-e昀케cient and In 2022, we 昀椀led a patent for using machine we’re collaborating with industry peers to highlight the emissions than an equivalent steel and concrete structure, 70 learning technology to improve our ability to impo爀琀ance of low-GHG construction materials, such low-carbon facilities factoring in sequestration. prevent emissions from refrigerant leaks. as greener concrete, and to accelerate progress in the Preventing refrigerants from leaking and 昀椀nding low- development and deployment of these materials. We pursue a set of integrated strategies to reduce global warming potential (GWP) alternatives is critical for the carbon footprint of our facilities, including energy each one to maximize e昀케cient use of energy, water, 71 reducing global emissions. We’re taking steps to more e昀케ciency, building and 昀氀eet electri昀椀cation, on-site and materials. Data centers accurately measure refrigerant leak rates and working generation of clean energy, and carbon-free energy procurement. Reducing waste is another strategy, to develop new technology solutions that can prevent Our long-standing data center e昀케ciency e昀昀o爀琀s are Google’s data centers are the engine of our company, emissions from these leaks. For example, at our data which is covered in the Circular economy section. impo爀琀ant because our data centers represent the vast powering products like Gmail, Google Cloud, Search, and centers, we’re developing and deploying cooling solutions majority of our direct electricity use. To reduce their energy YouTube for billions of people around the world. We’ve that include natural, low-GWP refrigerants. When designing our data centers and o昀케ces, we consider use, we strive to build the world’s most energy-e昀케cient worked to make Google’s data centers some of the most options to reduce their carbon impacts, such as the computing network, ou琀昀i琀琀ing each data center with high- e昀케cient in the world, improving their environmental Google is a founding member of the iMasons Climate incorporation of low-GHG materials and adaptive reuse pe爀昀ormance servers that we’ve custom-designed to use as pe爀昀ormance even as demand for our products has risen. Accord, an industry coalition working to reduce GHG of existing buildings. For example, in Sunnyvale, California, li琀琀le energy as possible. For example, our tensor processing We’ve done this by designing, building, and operating emissions across the technical infrastructure systems we’re building our 昀椀rst ground-up mass timber building, unit v4 has enabled us to train machine learning algorithms with industry-leading e昀케ciency, resulting in signi昀椀cant 72 emissions reductions compared to business as usual. We also install sma爀琀 temperature and lighting controls, redesign how power is distributed to reduce energy loss, and employ advanced cooling techniques, including energy-e昀케cient evaporative cooling. At some sites, we also recapture heat generated by our servers and use it to heat our data center o昀케ce spaces and other on-site facilities. We continue to assess oppo爀琀unities 2022 HIGHLIGHT Compared with 昀椀ve years ago, we now deliver approximately three times as much computing power with the 73 same amount of electrical power. A visualization of the roof of our landmark Pla琀昀orm G o昀케ce development in King’s Cross, London. 37
Introduction Empowering individuals Working together Operating sustainably Governance and engagement Appendix 2023 Environmental Repo爀琀 for o昀昀-site heat recovery, where environmentally sound energy. Since 2012, our average annual 昀氀eet-wide PUE has Historically, research has shown that as AI/ML compute and technically feasible, considering the remote location of stayed at or below 1.12 (see Figure 13). demand has gone up, the energy needed to power this 2022 HIGHLIGHT many of our data centers and the infrastructure required. technology has increased at a much slower rate than Heat recovery is also a key pa爀琀 of our o昀케ce development In 2022, we maintained our ISO 50001 ce爀琀i昀椀cation for all many forecasts predicted. We have used tested practices As of 2022, over 1.8 million square strategy, as well as one of the main levers to help us Google-owned and -operated data centers in Europe that to reduce the carbon footprint of workloads by large meters (nearly 20 million square electrify—because reusing heat o昀琀en requires less energy met our operational threshold for power usage. We were margins; together these principles have reduced the feet) of Google o昀케ce facilities have than creating new heat. the 昀椀rst major internet company to achieve a multi-site energy of training a model by up to 100x and emissions achieved LEED ce爀琀i昀椀cation. energy management system ce爀琀i昀椀cation to ISO 50001, by up to 1,000x. For more information, see the AI for Our e昀昀o爀琀s have paid o昀昀. On average, a Google-owned which we 昀椀rst obtained in 2013. sustainability section. and -operated data center is more than 1.5 times as 74 energy e昀케cient as a typical enterprise data center and, O昀케ces compared with 昀椀ve years ago, we now deliver approximately 2022 HIGHLIGHT three times as much computing power with the same 75 On average, a Google-owned and For new o昀케ce buildings and spaces, we optimize amount of electrical power. In 2022, the average annual 76 overall pe爀昀ormance, including both e昀케ciency and user power usage e昀昀ectiveness (PUE) for our global 昀氀eet of -operated data center is more than experience (see Figure 14 on the next page for some data centers was 1.10, compared with the industry average 1.5 times as energy e昀케cient as a 77 examples). We design to internationally recognized of 1.55 —meaning that Google data centers use about 5.5 78 typical enterprise data center. and industry-leading green building standards, such times less overhead energy for every unit of IT equipment as Leadership in Energy and Environmental Design (LEED) ce爀琀i昀椀cation, Building Research Establishment Environmental Assessment Method (BREEAM), and FIGURE 13 International Living Future Institute’s (ILFI) Living Building Challenge (LBC) and Zero Carbon Ce爀琀i昀椀cation. Energy e昀케ciency at Google-owned and -operated data centers 1.20 As of 2022, over 1.8 million square meters (nearly 20 million Legend square feet) of Google o昀케ce facilities have achieved LEED 79 Trailing 12-month PUE 1.18 ce爀琀i昀椀cation. Of our LEED-ce爀琀i昀椀ed square footage, 27% h PUE has achieved a Platinum rating, and 60% a Gold rating. t 1.16 n 2-mo1.14 As we work to improve pe爀昀ormance across our existing g 1 po爀琀folio, we use energy management strategies, building 1.12 ailin 1.10 optimization, and data analytics to help drive e昀케ciency r T 1.10 measures like equipment upgrades, setpoint adjustments, and lighting retro昀椀ts. 1.08 We received the highest LEED ce爀琀i昀椀cation for our Google 0 2010 2012 2014 2016 2018 2020 2022 store in New York City’s Chelsea neighborhood. 38
Introduction Empowering individuals Working together Operating sustainably Governance and engagement Appendix 2023 Environmental Repo爀琀 FIGURE 14 Examples of energy- and carbon-e昀케cient Google o昀케ces 1105 Peachtree 6 Pancras Square Energy audits in Atlanta, Georgia, U.S.A. in London, U.K. in Asia-Paci昀椀c In 2022, we opened our 1105 Peachtree o昀케ce, which is designed to Our 6 Pancras Square o昀케ce was the 昀椀rst building project in the world In 2022, we conducted more than 20 energy audits across our largest meet LEED v4 Gold Ce爀琀i昀椀cation. To promote low-carbon commutes, to receive ILFI Zero Carbon Ce爀琀i昀椀cation. It’s also ce爀琀i昀椀ed LEED v2009 Asia Paci昀椀c sites. As a result, we identi昀椀ed more than 200 energy it’s located near mass transit and o昀昀ers on-site bike parking. It also conservation measures that we’re now actively implementing—which Platinum and received a BREEAM Excellent rating. includes sma爀琀 building technology throughout to decrease energy use. are projected to save a total of 5,600 MWh of energy. 39
Introduction Empowering individuals Working together Operating sustainably Governance and engagement Appendix 2023 Environmental Repo爀琀 by spend, provided data. Our supplier data is used to help Electri昀椀cation at our o昀케ces Sustainable travel 2022 HIGHLIGHT set goals and priorities for our sustainability program and we continue to re昀椀ne our data quality and methodology and commuting Electri昀椀cation—which helps enable transitioning away Google shu琀琀le buses in the Bay Area for calculating the carbon footprint associated with the from fossil fuels—is an essential 昀椀rst step toward produced savings of more than 10,000 manufacturing of our hardware products throughout their Our transpo爀琀ation team plans, implements, and operates decarbonizing our operations, followed by 24/7 CFE tCO life cycle. e emissions—the equivalent of sustainable commuting options that help Googlers get to procurement. We’re exploring oppo爀琀unities to electrify 2 taking on average more than 2,000 work by riding shu琀琀les, carpooling, taking public transit, our facilities, from retro昀椀琀琀ing existing building In 2022, in addition to our CDP supply chain disclosure 82 biking, or walking. systems, to including electri昀椀cation standards for new cars o昀昀 the road for a year. requests, we engaged with suppliers directly to drive development, to working with landlords on electri昀椀cation- We have a growing number of electric vehicles in improved data and accounting, including increased friendly leases for buildings we don’t own. completeness and accuracy for their Scope 1, 2, and our corporate 昀氀eet, and the majority of our global fuel Supplier engagement 3 emissions. consumption from non-electric vehicles is renewable We’ve been piloting technologies to enable building diesel. We strive to provide electric vehicle charging electri昀椀cation since 2010. For example, our 昀椀rst all- We work with many suppliers that are commi琀琀ed to stations for 10% of the total parking spaces at our Bay electric o昀케ce—1842 No爀琀h Shoreline in Mountain View, sustainability, and we’re pa爀琀nering with them to develop Developing roadmaps to Area headqua爀琀ers, and we continue to work toward this California—has been in operation for over a decade. decarbonization roadmaps and build essential data reduce emissions design standard for new development projects. Many of these pilots led us to con昀椀dently implement new infrastructure to accurately quantify emissions and technology in our large development projects. In 2022, reductions across the value chain. Since se琀琀ing our net-zero emissions goal, we’ve engaged To date, we’ve installed more than 5,000 electric vehicle we advanced a comprehensive plan to electrify systems our key suppliers to develop roadmaps to reduce charging po爀琀s at our o昀케ces. We estimate that employee across our building po爀琀folio. We engage with our suppliers—including hardware emissions across our supply chain. During Google’s EV commuting in the United States and Canada prevented manufacturing and indirect services suppliers—to help 80 roughly 12,000 tCO e emissions in 2022. 2022 Supplier Sustainability Summit, we communicated More recently, in 2022, we opened Bay View—an all- 2 reduce their energy consumption and GHG emissions, the expectation for suppliers to publicly set targets to electric campus with an innovative geothermal installation as stated in our Supplier Code of Conduct, which all reduce GHG emissions. We provide in-depth training Many campuses o昀昀er commuter shu琀琀les to reduce and the largest electric kitchen in our global po爀琀folio. suppliers are required to sign. We assess suppliers’ individual vehicle trips. In 2022, we launched an for key suppliers on se琀琀ing ambitious GHG reduction Learn more in our Bay View spotlight. practices to repo爀琀, manage, and reduce their emissions and renewable electricity targets. For suppliers that expansion of our all-electric buses for the Bay Area and and incorporate this into our supplier scorecard. completed our CDP supply chain survey, 75% repo爀琀ed are introducing these throughout 2023 to replace our We’re also working to eliminate use of natural gas by having GHG emissions reduction targets, and of those existing 昀氀eet. For 2022, our shu琀琀le buses in the Bay Area designing all-electric kitchens at our o昀케ces, including in suppliers, 36% repo爀琀ed that their target is science- produced savings of more than 10,000 tCO e emissions— the Bay Area, Europe, and Latin America. 2 Repo爀琀ing based. We aim to accelerate our suppliers’ GHG the equivalent of avoiding more than 41 million vehicle km environmental data emissions reductions through fu爀琀her integration of (25 million vehicle miles) or taking on average more than 81 climate pe爀昀ormance into key procurement tools and the 2022 HIGHLIGHT 2,000 cars o昀昀 the road for a year. We expect all our suppliers to repo爀琀 environmental data, development of new mechanisms to drive deep supplier and we encourage them to respond to CDP’s Climate decarbonization. In 2022, we opened Bay View—an all- electric campus. Change survey. In 2022, we invited 222 suppliers to pa爀琀icipate, and at least 90% of our hardware suppliers, 40
Introduction Empowering individuals Working together Operating sustainably Governance and engagement Appendix 2023 Environmental Repo爀琀 Renewable energy Advancing carbon-free energy procurement Our primary approach for reducing our Scope 2 emissions We’re working to achieve 24/7 CFE through three main We buy electricity directly from new wind and solar farms 83 is through the procurement of carbon-free energy. Since initiatives: purchasing carbon-free energy, accelerating via long-term PPAs on the grids where we operate, and we 2017, we’ve matched 100% of the electricity consumption of new and improved technologies, and transforming the also buy renewable power through utilities via renewable our global operations with purchases of renewable energy energy system through pa爀琀nerships and advocacy. energy purchasing models that we helped create. 84 on an annual basis. From 2010 to 2022, we signed more than 80 agreements However, because of di昀昀erences in the availability of Purchasing totaling approximately 10 GW of clean energy renewable energy sources like solar and wind across the carbon-free energy generation capacity—the equivalent of more than regions where we operate—and because of the variable 31 million solar panels. Through these agreements, we supply of these resources—we still need to rely on estimate we’ll spend approximately $10 billion to purchase Achieving 24/7 CFE is far more complex and technically 86 carbon-emi琀琀ing energy sources that power local grids clean energy through 2040. challenging than annually matching our energy use with (see Figure 15). That’s why, in 2020, we set a goal to run on renewable energy purchases. No company of our size 24/7 carbon-free energy on every grid where we operate In 2022, we signed contracts for approximately 2.8 GW has achieved 24/7 CFE before, and there’s no playbook by 2030, aiming to procure clean energy to meet our of clean energy capacity—more than in any prior year. for making it happen. But we see our e昀昀o爀琀s as pa爀琀 of a electricity needs, every hour of every day, within every This included two new projects in the U.K. and Spain, our bigger picture, and we’ve set this ambitious goal to help grid where we operate. Achieving this will also increase 昀椀rst in each country, that will help our Cloud regions and scale new, global solutions. We’re excited to see others—like the impact of our clean energy procurement on the o昀케ces move closer to 24/7 CFE. the U.S. federal government—set similar goals as well. 85 decarbonization of the grids that serve us. FIGURE 15 2022 HIGHLIGHT Hourly carbon-free energy pe爀昀ormance at an example data center Legend While Google buys large amounts of wind and solar power (symbolized by green spikes From 2010 to 2022, we signed Gaps in carbon-free energy below), these resources are variable, meaning that our data centers still sometimes rely Carbon-free energy supply on carbon-based resources. more than 80 agreements totaling approximately 10 GW of clean energy January 1 December 31 generation capacity. Through these agreements, we estimate we’ll spend approximately $10 billion to purchase 87 clean energy globally through 2040. Data center electricity demand Maevaara wind farm in Sweden (105 MW for Google) 41
Introduction Empowering individuals Working together Operating sustainably Governance and engagement Appendix 2023 Environmental Repo爀琀 In 2022, we also saw projects we’d contracted over the • Finland: Google signed a contract with Ilmatar FIGURE 16 past few years becoming operational in Belgium, Chile, for approximately 60% of the 211 MW generation Renewable energy purchasing compared with total electricity use Denmark, and Finland—providing impo爀琀ant clean energy capacity Piiparinmäki, Finland’s largest wind farm, resources to the grids where we operate, and bringing us which was completed in November 2021. Google’s Legend closer to 24/7 CFE: early agreement to buy the output of this project was 21.78 22 Total electricity consumption critical to the wind farm ge琀琀ing built, and in 2022 it 100% 20 • Belgium: At our facility in St. Ghislain, Belgium, we became fully operational and began feeding into Renewable energy % 100% 18 installed the 昀椀rst-ever ba琀琀ery-based backup power the grid that powers our Hamina data center. El 16 e c system for a data center. 100% tri Google 昀椀rst 14 ci In 2017, we became the 昀椀rst major company to match (TWh)t • Chile: In 2019, Google signed a contract with AES achieved 100% 12 y c 100% of the annual electricity consumption of our global RE match 100% o Chile to build 23 new wind turbines in Chile’s Biobío n region. The project is pa爀琀 of a hybrid wind and solar operations with renewable energy purchases. As of the Google 100% 10 sump public goal to 8 end of 2022, we’ve now achieved six consecutive years t i po爀琀folio that adds 125 MW of clean energy generation 100% RE match 100% o capacity. With this wind farm now operational, our of 100% renewable energy matching on an annual basis 6 n 4 (see Figure 16). 61% data center in Chile operated at 90% CFE in 2022. 48% 2 34% 35% 37% 0 • Denmark: The Rødby Fjord solar project began adding From 2011 to 2022, our renewable energy purchasing 2011 2012 2013 2014 2015 2016 2017 2018 2019 2020 2021 2022 carbon-free energy to the grid that powers our data has resulted in emissions savings of more than 30 million center in Fredericia, Denmark. In total, this project tCO2e—equivalent to taking more than 6 million cars o昀昀 adds 54.5 MW of generation capacity to the more the road for a year, or the carbon sequestered by more 88 than 100 MW of existing operational solar resources than 36 million acres of U.S. forests in a year FIGURE 17 in Denmark. (see Figure 17). Annual impact of renewable energy purchases on Scope 2 emissions Legend 8 Without renewable energy 8.05 With renewable energy 6 Sc ( o mi pe 2 emiss l l i o n 4 tC 2O e i ) o n 2.49 2 s 0 2011 2012 2013 2014 2015 2016 2017 2018 2019 2020 2021 2022 Rødby solar farm in Denmark (55 MW for Google) 42
Introduction Empowering individuals Working together Operating sustainably Governance and engagement Appendix 2023 Environmental Repo爀琀 these di昀케culties, load growth continued in regions where TARGET 2022 PROGRESS CFE contracting is especially di昀케cult given local market Run on 24/7 carbon-free 64% global average carbon- dynamics and resource availability constraints (such as the PJM [Pennsylvania-New Jersey-Maryland] grid region energy on every grid where free energy across our data in the eastern United States and ce爀琀ain Asia Paci昀椀c grid regions). we operate by 2030 centers and o昀케ces Despite these signi昀椀cant headwinds, we’re proud of the progress we were able to make across many of our data DETAILS center facilities. Seven of our 41 grid regions achieved at least 90% CFE, and 13 achieved at least 85% CFE Year set: 2020 | Base year: N/A | Target year: 2030 89 Scope: Regional % carbon-free energyscores , averaged across Google’s global po爀琀folio of data centers (see Figure 18). These 13 grid regions span No爀琀h America, Latin America, and Europe. and o昀케ces for 2022. This represents the clean energy procured to meet our electricity needs, every hour of every day, within every grid where we operate. In 2022, we expanded our repo爀琀ing from only Google-owned While load grew signi昀椀cantly within the central United and -operated data centers to also incorporate o昀케ces and third-pa爀琀y data centers. States, our CFE procurement in this region kept pace— keeping the Midcontinent Independent System Operator and Southwest Power Pool among our highest-scoring 24/7 CFE progress grid regions. We increased our contracted CFE in the operated facilities. Without this change in methodology, U.K., Finland, and Germany. CFE for Google-owned and -operated data centers would We believe in transparency as a guiding principle, so have remained relatively 昀氀at year-over-year. this year, we’re expanding our carbon-free energy To see more data regarding CFE by region, see the repo爀琀ing. For the 昀椀rst time, we’re including CFE scores Environmental data table. Our total electricity load across all data center facilities for both Google-owned and -operated data centers and increased by roughly 3 TWh (18%) from 2021 to 2022, while third-pa爀琀y facilities where Google leases space and 91 O昀케ces our contracted CFE increased by roughly 2 TWh (17%). data processing capacity to suppo爀琀 our services. As a Despite this signi昀椀cant expansion of carbon-free energy 90 result, there are new grid regions included in this year’s For our o昀케ces, which represent a small po爀琀ion of our supply, the percentage of our energy use that came from repo爀琀ing. We’re also including a separate CFE score of global CFE score, we achieved approximately 56% round- carbon-free sources remained relatively 昀氀at because of the global average for our o昀케ces. the-clock carbon-free energy. the signi昀椀cant growth in our total electricity load. Data centers Beyond the challenge of growing our CFE CFE for commercial real estate faces di昀昀erent challenges, procurement to keep up with our growing power including variability in building characteristics, work In 2022, we achieved approximately 64% round-the-clock pa琀琀erns, and geographic locations with a broad range of demand, last year we also faced headwinds that made it carbon-free energy across all of our data center sites, electricity grid carbon intensities. In addition to helping more challenging to purchase CFE—including continued inclusive of those operated by third pa爀琀ies. Our 2022 CFE us achieve our own climate goals, pursuing CFE for our disruptions to renewable energy supply chains, delays represents a 2% change from 2021 (66% CFE), as a result o昀케ces can help expand clean energy options in the cities for interconnecting new utility-scale projects, and Golden Hills wind farm in California (43 MW for Google) of updating our metric this year to include third-pa爀琀y we call home. increased demand for clean energy projects. Adding to 43
Introduction Empowering individuals Working together Operating sustainably Governance and engagement Appendix 2023 Environmental Repo爀琀 FIGURE 18 Global data center carbon-free energy map In 2022, Google reached 64% carbon-free energy globally on TENNESSEE DENMARK an hourly basis. This pe爀昀ormance 90% 63% varied widely by region, with seven IOWA IRELAND FINLAND 96% OHIO 97% of our regions achieving at least 39% 60% 90% carbon-free energy, and NEBRASKA 87% VIRGINIA thi爀琀een achieving at least 85%. 60% OREGON 89% NORTH CAROLINA 63% NETHERLANDS NEVADA 57% 27% SOUTH CAROLINA BELGIUM 26% 80% JAPAN How to read clocks 16% TAIWAN UTAH ALABAMA 18% 31% Example 100% match with TEXAS 63% GEORGIA carbon-free energy 40% 41% Midnight SINGAPORE 4% OKLAHOMA 87% 18:00 06:00 CHILE 90% 12:00 0% match with carbon-free energy 44
Introduction Empowering individuals Working together Operating sustainably Governance and engagement Appendix 2023 Environmental Repo爀琀 communities that host our facilities—in pa爀琀icular, Innovative purchasing historically underserved communities that haven’t Accelerating new and We’re deploying machine learning models typically bene昀椀ted from the clean energy transition. Three improved technologies solutions to optimize wind power years ago, we sta爀琀ed a journey to be琀琀er understand how forecasting and project economics. Our early adoption and long-term suppo爀琀 of clean energy we can help lower barriers to an equitable clean energy Wind and solar power have played a critical role in projects has coincided with the rapid growth of the transition, culminating in two additions to our clean energy enabling Google’s clean energy progress, but meeting local solar and wind power are most plentiful, and industry and remarkable declines in the cost of solar and procurement approach that respond to those challenges. 24/7 CFE—and maximizing our contribution to global 92 to shi昀琀 tasks geographically across data centers so wind power. Along the way, we’ve pioneered innovative decarbonization—will require expanding our technology that we can do more computing in regions where new contracting models and industry pa爀琀nerships to The 昀椀rst program extends clean energy’s 昀椀nancial toolkit. In 2022, we continued to work on a wide range CFE is abundant. help accelerate the adoption of corporate clean energy bene昀椀ts to local communities. Through a 昀椀rst-of-its- of projects to demonstrate, scale, and maximize the practices and make clean energy more accessible to a kind pa爀琀nership with EDPR NA Distributed Generation, climate impact of carbon-free energy technologies, • Accelerating next generation energy sources: wider range of corporate buyers. we’ll create a 500 MW community-based solar po爀琀folio, using Google’s engineering capabilities and purchasing In 2021, we signed the 昀椀rst corporate agreement to adding clean energy to the regional U.S. PJM power grid demand to accelerate the commercialization of new develop a next-generation geothermal power project, New contracting approaches and providing Google with Renewable Energy Credits clean energy technologies: and in 2022, we installed the 昀椀rst-ever ba琀琀ery- that contribute to 24/7 CFE. At least 10% of the po爀琀folio’s based backup power system for a data center at our revenues will be redirected annually for up to 15 years as In 2022, we published a white paper outlining details of the Optimizing generation from existing CFE • facility in St. Ghislain, Belgium. This application will CFE Manager model, a new approach to clean energy utility bill credits to more than 25,000 households facing a technologies: To reduce the carbon footprint of enable Google to optimize the carbon footprint of high energy burden. procurement that can help a wide range of energy buyers our new Bay View and Charleston East campuses, backup power, buying local, low-carbon power for streamline their clean energy purchasing. We share three we designed and installed “dragonscale,” a new solar backup when available rather than relying on diesel The second program aims to spur long-term investments case studies where Google recently signed CFE Manager roo昀椀ng technology that helps us power our facilities generators. to improve housing infrastructure. Through a pa爀琀nership agreements—in Virginia, Germany, and California—and through on-site generation. Learn more in our • Improving energy data and clean energy tracking: with Sol Systems, we’re providing funding to three rural discuss some contractual terms and issues that buyers Bay View spotlight. Google is driving the development of advanced electric cooperatives and one regional organization pursuing these agreements should consider. Managing energy demand across our global • methods for tracking clean energy, including time- with deep roots in No爀琀h Carolina and South Carolina to operations: We developed a “carbon-intelligent based energy a琀琀ribute ce爀琀i昀椀cates. We’re also working unde爀琀ake critical home pre-weatherization and safety In addition to the CFE manager model, in 2022 we piloted computing pla琀昀orm” that optimizes the timing and to improve the quality, consistency, and granularity of upgrades for low- and moderate-income households. a new approach to clean energy requests for proposals location of computing tasks based on local CFE grid electricity data through active collaborations with Alongside this investment, the pa爀琀nership will deliver new that can reduce the time to negotiate and execute a availability. This allows us to shi昀琀 some of our data organizations including EnergyTag, Electricity Maps, solar energy and ba琀琀ery storage resources, moving us clean energy PPA by up to 80%. We’re hopeful this new centers’ computing tasks to the times of day when FlexiDAO, and more. closer to 24/7 CFE and bringing clean energy to one of the approach will give clean energy buyers and sellers most challenging grids to decarbonize. useful new options for negotiating PPAs, and enable all organizations that want to decarbonize their electricity Both of these programs are based on discussions with use to join us on the journey to 24/7 CFE. U.S. government o昀케cials, national NGOs, and policy Helping local communities advocates about challenges to an equitable energy transition in their communities. We’ll continue to build on these programs to extend the bene昀椀ts of our investments Finally, we believe that our clean energy procurement For our Bay View campus, a 昀椀rst-of-its-kind building-integrated solar panel called “dragonscale” was developed to underserved communities. shouldn’t only bene昀椀t the climate, but also the local to create a seamless design. (Photo: Iwan Baan) 45
Introduction Empowering individuals Working together Operating sustainably Governance and engagement Appendix 2023 Environmental Repo爀琀 clean energy buyer around the world. As we advance In addition to purchasing renewable energy for our Transforming the CFE for supplier operations toward our goal of 24/7 CFE, we’re commi琀琀ed to working own operations, we also make targeted investments in energy system through with others and advocating for clean energy policies renewable energy. Investment in renewable capacity is More of our suppliers are using renewable energy. Of that can enable 24/7 CFE for all energy consumers by a scalable approach to creating system-level change by the suppliers invited to repo爀琀 to Google via CDP Supply pa爀琀nerships and decarbonizing electricity grids at the scale and pace driving grid decarbonization and enabling greater access Chain, 26% (58 suppliers) said they have renewable energy advocacy required to meet the world’s climate challenge. to carbon-free energy. This is especially signi昀椀cant in targets, and 12% (26 suppliers) have targets that are pa爀琀 markets where credible procurement mechanisms for of the RE100 initiative. To accelerate decarbonization of Global search interest in “sustainable energy” We also recognize that accurate, comprehensive, and clean energy are nascent or nonexistent. We aim to invest our supply chain, we’re engaging with our key suppliers to actionable corporate GHG inventories are essential to in clean energy projects that reduce emissions and serve 93 reached an all-time high in March 2022. Our 24/7 CFE encourage them to commit to procuring 100% renewable help companies understand their carbon footprints and manufacturing operations across our supply chain. e昀昀o爀琀s are designed to maximize our contribution to the energy for their operations. determine how to mitigate emissions. That’s why we decarbonization of power grids worldwide. That’s why recently submi琀琀ed comments in response to an open Google aims to enable 5 GW of new carbon-free we’re suppo爀琀ing others to join us on the journey to 24/7 survey on the future of the Greenhouse Gas Protocol energy through investments in our key manufacturing Our work in increasing supplier access to renewable CFE, by sharing insights and lessons we’re learning and (GHGP). Updating the GHGP will drive continued regions by 2030. In 2022, we signed agreements to invest energy is intentionally inclusive. We aim for our new approaches we’re developing. investments in renewable energy and energy e昀케ciency to improvements in the accuracy of companies’ GHG approximately $350 million to suppo爀琀 0.5 GW of renewable drive be琀琀er manufacturing across Google’s supply chain One such example is the United Nations 24/7 Carbon- inventories, providing useful information that enables energy projects towards this 5 GW total. This builds on our and—impo爀琀antly—to reduce the environmental impact them to make decisions and take actions that drive real, long-standing track record in this space; From 2010 to 2022, free Energy Compact, which we helped launch with of manufacturing for people and communities around measurable GHG reductions. we entered into agreements to invest nearly $2.9 billion in Sustainable Energy for All and other pa爀琀ners in 2021. The the world. renewable energy projects with an expected combined Compact is a global community dedicated to building the For more information on our public policy and advocacy, generation capacity of approximately 4.2 GW. technologies, policies, tools, ideas, and advocacy needed Looking ahead, we’re working to: see the Governance and engagement section. to accelerate the decarbonization of electricity grids. Towards our 5 GW goal, Google’s investments will be In Europe, we work with the European 24/7 CFE Hub, a • Close our 昀椀rst renewable energy investment deal in a targeted to suppo爀琀 bringing additional carbon-free collaboration with Eurelectric to create a pla琀昀orm where key Asia Paci昀椀c manufacturing region, working toward energy capacity online in key manufacturing regions CFE investments energy buyers, suppliers, and policy makers can meet to our broader goal to enable 5 GW of new carbon-free around the globe, including in No爀琀h America, Latin learn more about 24/7 CFE and receive technical training energy in key regions by 2030. America, Europe, and Asia Paci昀椀c. Such projects may Google works with suppliers around the world. The and implementation guidance. reduce Google’s carbon footprint directly, may reduce electricity grids in many countries where our suppliers • Increase access to cost-e昀昀ective renewable energy at a Google supplier’s carbon footprint, or may simply help operate lack su昀케cient carbon-free energy capacity to scale for supply chain pa爀琀ners in key manufacturing decarbonize the local grid. suppo爀琀 rapidly growing demand, and may even face regions through direct supplier and public policy Public policy and advocacy energy sho爀琀ages that a昀昀ect not just manufacturing engagements. Asia Paci昀椀c—a critical region for our suppliers—is one of but also the communities and livelihoods of the people In addition to corporate action, we recognize that the • Pa爀琀icipate in advocacy e昀昀o爀琀s related to supply chain the most challenging regions for contracting or investing in these regions. Our long-term vision is that all of our clean energy transition also requires strong actions from renewable energy and carbon mitigation, working 94 in carbon-free energy projects. Making carbon-free suppliers—for hardware manufacturing, transpo爀琀, governments, and we call for ambitious public policies collaboratively with industry-leading institutions to energy investments in key Asia Paci昀椀c regions is, and will logistics, and indirect services—and their communities aimed at decarbonizing electricity grids worldwide. In research solutions and share best practices. continue to be, an area of deep focus for Google moving 2022, we published a 昀椀rst-of-its-kind policy roadmap have access to reliable, cost-e昀昀ective, carbon-free forward. Google has identi昀椀ed several promising carbon- energy. And we’ll get there only through signi昀椀cant global sharing our recommendations for energy policy and free energy investment oppo爀琀unities in the region, all of investment in new wind, solar, and other clean energy market reforms to accelerate electricity decarbonization, which are in various stages of due diligence. capacity, as well as more robust grid systems. informed by our experiences as a large energy user and 46
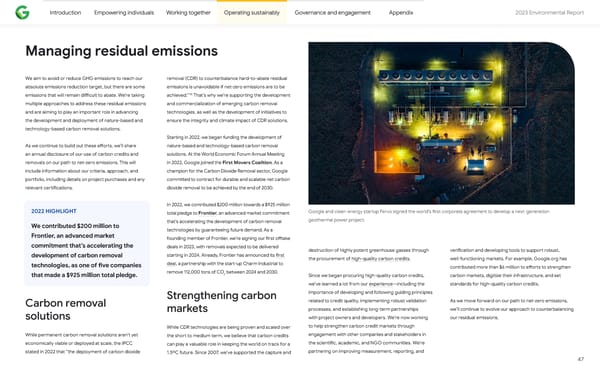
Introduction Empowering individuals Working together Operating sustainably Governance and engagement Appendix 2023 Environmental Repo爀琀 The journey ahead As we move forward on our journey to reduce our The clean energy transition also requires strong emissions, we’ll continue to focus both on our own actions from governments, and we call for ambitious footprint and on the larger systems that serve us—from public policies aimed at decarbonizing electricity grids electricity grids to transpo爀琀ation networks to materials worldwide. supply chains. • Policy recommendations to accelerate We’ve made great progress in procuring clean energy, carbon-free energy but we still have a long way to go to meet our 2030 net-zero target. We recognize we’ll face many challenges Ultimately, achieving a carbon-free future for all requires along the way, for example: rapid and far-reaching transformations to these systems, and as we grow our e昀昀o爀琀s towards net-zero emissions • Meeting our growing energy needs for our own footprint, we’ll prioritize actions where we can make unique contributions and maximize our impact on • Availability of carbon-free energy larger systems change. • Cost and limited volumes of carbon removals LEARN MORE For more details, see the Challenges to address • Accelerating climate action at Google and beyond: section above. A progress update We also know we can’t get there alone. To scale our • 24/7 carbon-free energy: Methodologies and metrics work, we’ve created tools, white papers, and case studies to help others adopt some of the approaches that have worked for us. • The CFE manager: A new model for driving decarbonization impact • Time-based energy a琀琀ribute ce爀琀i昀椀cates El Romero solar farm in Chile (80 MW for Google) 48
Introduction Empowering individuals Working together Operating sustainably Governance and engagement Appendix 2023 Environmental Repo爀琀 Our ambition Our approach The world is facing an unprecedented At Google, we use water to help cool our data centers, water crisis, with global freshwater demand and in our o昀케ces around the world. Water is also used predicted to exceed supply by 40% by throughout our value chain, in the manufacturing of both consumer hardware products and data center equipment. 2030. 96 Climate change has exacerbated water stress, causing destabilizing We work to drive water e昀케ciency and reuse across our droughts and unpredictable 昀氀ooding global operations, from reducing our potable water use around the world. intensity at our San Francisco Bay Area headqua爀琀ers to using seawater for cooling at our data center in Hamina, Finland. In 2021, we announced our commitment to water 97 stewardship: we aim to replenish 120% of the freshwater Our water stewardship strategy is centered on volume we consume, on average, across our o昀케ces assessing and addressing water-related risks to our and data centers by 2030, and help restore and improve business and the oppo爀琀unities we have to not just Our ambition the quality of water and health of ecosystems in the mitigate those risks, but also create solutions that can be Water communities where we operate. This ambition is bold, scaled beyond our own corporate footprint. We also strive Our approach pa爀琀icularly when considering both the growth of our to pa爀琀ner with others to address this shared challenge. business and the challenges and complexities of global water stewardship work. Understanding the most stewardship When it comes to addressing shared water challenges, impac琀昀ul intervention requires local context, and water Advancing responsible technology can be a useful tool to bring visibility to these replenishment is still a maturing 昀椀eld with some limitations water use challenges to enable sma爀琀er, more informed decision- to identifying ready-to-implement project oppo爀琀unities. making. We’re building tools to make water data and We aim to replenish more technology universally accessible, enabling e昀昀ective We’re working to achieve this replenishment target Bene昀椀ting watersheds and water stewardship and improving the resilience of through continued and scaled investments in projects water than we consume and communities watersheds and ecosystems. that are located within the watersheds we rely on to help improve water quality provide water to our data centers and o昀케ces. We work Suppo爀琀ing water security with external pa爀琀ners to implement these projects, which deliver both volumetric water bene昀椀ts and improve other and ecosystem health in the with technology locally relevant aspects of watershed health, such as communities where we operate The journey ahead water quality, community water access, and biodiversity. 49
Introduction Empowering individuals Working together Operating sustainably Governance and engagement Appendix 2023 Environmental Repo爀琀 Advancing responsible water use We’re commi琀琀ed to advancing and enhancing our water use non-potable sources of freshwater and alternatives to management practices across our operational footprint freshwater. at Google’s o昀케ces and data centers around the world. We continue to collaborate, test, and share our learnings As pa爀琀 of our commitment to using water responsibly, we on responsible water use. This includes accelerating water evaluate and take into account local water stress when reuse practices across our o昀케ces and data centers, and deciding where to locate our facilities, how to design tailoring site-speci昀椀c solutions based on facility types, them, and how to operate them—from water systems in locations, and local water contexts. our o昀케ces to cooling systems in our data centers. That’s why, in 2022, 82% of our freshwater withdrawals came These colo爀昀ul pipes in our Douglas County, Georgia data center send and receive water for cooling our facility. 99 In 2022, total water consumption at our data centers and from regions with low water stress. In locations facing o昀케ces was 5.6 billion gallons—the equivalent of what it water stress, we’re actively exploring new pa爀琀nerships Data centers takes to irrigate 37 golf courses annually, on average, in the and oppo爀琀unities to improve overall watershed health and 98 southwestern United States. Wherever feasible, we try to resilience. By working to replenish more than we consume, To minimize the net-climate impact at each of our data center in Douglas County, Georgia, we redirect local we’re striving to help address the water scarcity gap. center campuses, both today and in the future, we consult sewer water that would otherwise be discharged in with local expe爀琀s and make regionally appropriate cooling the Cha琀琀ahoochee River and use it to cool our facility. FIGURE 19 technology decisions that balance the availability of Additionally, our data center in Hamina, Finland, uses carbon-free energy and responsibly sourced water. seawater for cooling rather than withdrawing freshwater. Our water stewardship focus areas Additionally, at our data center in Eemshaven, the In many places, water is the most e昀케cient means of Netherlands, we pa爀琀nered with the community to bring cooling. When used responsibly, water cooling can play in industrial canal water to cool our data center, leaving an impo爀琀ant role in reducing emissions. We’ve found that potable water for other uses. our water-cooled data centers use about 10% less energy and emit roughly 10% less carbon emissions than our air- In 2022, we described our climate-conscious data 100 cooled data centers. center cooling strategy, in which we both championed Advance responsible Suppo爀琀 water security Bene昀椀t watersheds water use and communities with technology responsible water use and explained how this work At our data centers, we aim to implement technologies complements our e昀昀o爀琀s to run on 24/7 CFE on every and solutions that reduce freshwater consumption when grid where we operate by 2030. In this blog, we published Share technology and tools Collaborate to replenish Enhance our stewardship feasible, and use alternative sources such as reclaimed our 2021 annual water metrics for our U.S. data center that enable everyone to our freshwater consumption and of water resources across wastewater and even seawater. We withdraw reclaimed or locations, and commi琀琀ed to sharing annual water metrics predict, prevent, and recover improve watershed health while Google o昀케ce campuses non-potable water at 25% of our data center campuses. for additional global locations beginning with this repo爀琀. suppo爀琀ing ecosystems and from water stress and data centers Due to these solutions, 23% of our total data center water See our Environmental data tables for our 2022 water water-stressed communities withdrawal (excluding seawater) is reclaimed wastewater data—disclosed both globally and by data center location. and other non-potable water. For example, at our data 50
Introduction Empowering individuals Working together Operating sustainably Governance and engagement Appendix 2023 Environmental Repo爀琀 O昀케ces Supply chain Around the world, our o昀케ces use water for a variety Addressing water challenges requires accurate water of needs including preparing food, cleaning and use data throughout our supply chain. By monitoring hygiene, irrigating campus landscapes, and keeping our this data, we can focus our water stewardship e昀昀o爀琀s workspaces cool. We take a variety of approaches to on supplier facilities with the greatest oppo爀琀unities for manage water responsibly and drive responsible water improved management. To measure water use and assess use in our real estate operations through increased water risk in our value chain, we ask suppliers to disclose e昀케ciency and by sourcing water from non-potable water-related data via the CDP supply chain pla琀昀orm supplies. and complete and disclose water risk assessments of their direct operations and value chain. One of the main ways we conserve water in Google workplaces is by adopting design standards aligned In 2022, 177 of the 186 suppliers (95%) that were invited with leading third-pa爀琀y ce爀琀i昀椀cations, including LEED to pa爀琀icipate in the Water Security po爀琀ion of the CDP and the LBC. Our building design requirements for new Supply Chain survey responded. This repo爀琀ing includes construction include the incorporation of water-e昀케cient data on water withdrawal, consumption, and discharge— 昀椀xtures, such as faucets, toilets, and irrigation systems. all water withdrawn from all sources (e.g., su爀昀ace water, These design standards also address replacing old 昀椀xtures groundwater, rainwater, municipal water supply, and with highly e昀케cient ones in any space we move into, and trucked water), the po爀琀ion of water permanently lost in the installing water meters with automatic leak detection. In withdrawal (e.g., evaporated or incorporated into products multiple o昀케ces around the world, we’ve achieved Alliance from cooling, irrigation, and production processes), and the for Water Stewardship ce爀琀i昀椀cation, a leading third-pa爀琀y water e昀툀uents discharged to all locations (e.g., subsu爀昀ace standard that helps us develop best-in-class, regional and su爀昀ace waters, sewers, and groundwater). strategies for responsible water use, and to engage with local pa爀琀ners on watershed health projects. To learn more about how we assess and manage our water- related risks, see the Governance and engagement section. Beyond these standards, we drive water stewardship in our workplaces by developing innovative solutions that strive to be replicable and scalable. For example, our new Bay 2022 HIGHLIGHT View campus, which opened in 2022, is on track to be the As of the end of 2022, we estimate largest development project in the world to achieve Water Petal ce爀琀i昀椀cation from the LBC, with an on-site stormwater our 38 replenishment projects had the and wastewater treatment system that can serve as a capacity to replenish over 1.3 billion model for others. Learn more in our Bay View spotlight. gallons of water annually once 101 fully implemented. Steam rises above the cooling towers at our data center in The Dalles, Oregon. 51
Introduction Empowering individuals Working together Operating sustainably Governance and engagement Appendix 2023 Environmental Repo爀琀 Bene昀椀ting watersheds and TARGET 2022 PROGRESS communities Replenish 120% of the As of the end of 2022, our freshwater volume we contracted watershed projects Many watersheds around the world are degrading in health, consume, on average, Water replenishment have replenished 271 million with each location facing unique challenges. Improving watershed and ecosystem health is a critical pa爀琀 of our projects across our o昀케ces and gallons of water, or 6% of our strategy, which allows us to focus on solutions to shared data centers by 2030 2022 freshwater consumption water challenges that are impacting watersheds the most, In suppo爀琀 of our water stewardship strategy, we’ve made whether they’re related to water quantity and availability, progress in helping to restore and improve the quality of water quality, ecosystem and habitat degradation, loss of DETAILS water and health of ecosystems in the watersheds we rely biodiversity, or community access to water. on. We’ve intentionally designed our strategy to prioritize Year set: 2021 | Base year: N/A | Target year: 2030 a range of watershed health issues, enabling us to invest Scope: Freshwater replenished annually (excluding seawater and reclaimed wastewater), as a percentage of In addition to focusing on responsible water use within our in a diverse set of impac琀昀ul watershed health projects the amount of freshwater we consume each year at our o昀케ces and data centers. Replenishment bene昀椀ts are operations, we aim to replenish 20% more freshwater that are appropriate for each local context. counted from projects that are active within the watersheds that our operations rely on and that have con昀椀rmed than we consume each year, on a global average basis. volumetric bene昀椀ts from the repo爀琀ing year. We’ll focus our replenishment e昀昀o爀琀s in watersheds that We conduct regular water risk assessments of our global Google o昀케ces and data centers rely on. The additional assets to identify priority basins. Within each priority volume of water we replenish at each location will vary basin, we assess local water context and shared water depending on the local conditions, and we’ll prioritize challenges through data analysis and engaging with local replenishment projects in water-scarce regions to help pa爀琀ners and stakeholders. ensure that we’re positively impacting the areas that need it most. As of the end of 2022, we’ve suppo爀琀ed 38 water stewardship projects in 26 watersheds (see Figure 20). As of the end of 2022, the 昀椀rst full year since we launched In 2022 alone, we added 25 projects to our po爀琀folio. this strategy and target, our contracted watershed 102 projects have replenished 271 million gallons of water — This marked a strong 昀椀rst year of implementation of our equivalent to more than 400 Olympic-sized swimming water replenishment strategy, and while we still have a pools. This represents 6% of our 2022 freshwater long way to go to meet our 2030 target, we’re proud of consumption. As of the end of 2022, we estimate that the impac琀昀ul pa爀琀nerships that we’ve already engaged these 38 replenishment projects had the capacity to in around the world. We’re excited to continue working replenish over 1.3 billion gallons of water annually once alongside our existing pa爀琀ners and to 昀椀nd new pa爀琀ners fully implemented. in water-stressed geographies where we’ll work over the next few years. A rainwater retention pond outside our data center in Berkeley County, South Carolina. 52
Introduction Empowering individuals Working together Operating sustainably Governance and engagement Appendix 2023 Environmental Repo爀琀 FIGURE 20 Global water replenishment project map This map shows all 38 water stewardship projects we’ve suppo爀琀ed as of the end of 2022, with highlights of speci昀椀c projects and pa爀琀nerships: CALIFORNIA UNITED KINGDOM We recently co-funded a pilot project to install water-saving We pa爀琀nered with the Bonneville Environmental Foundation to fund technology in three multi-family buildings in Los Angeles. The Thames21 to suppo爀琀 the creation of a system of wetlands that will intercept and 昀椀lter water at Chinbrook Meadows park before it enters technology takes aim at behind-the-scenes leaks, like malfunctioning the River Quaggy and the greater Thames River watershed, improving toilets, that are capable of leaking thousands of gallons of water in a water quality with the added bene昀椀ts of 昀氀ood protection, climate single day. The pilot is on track to save a total of 6.4 million gallons of adaptation, and recreation oppo爀琀unities. water a year in the L.A. watershed where we operate. We’re also funding work to bring this approach to pa爀琀s of San Francisco and New York City. INDIA ARIZONA We’re working with United Way of Hyderabad to restore the Su爀昀ace water diversions from the Colorado River make up the primary Mullakathuva Lake in no爀琀hwest Hyderabad, with CLEAN International source of irrigation water supply for the Colorado River Indian Tribes to reopen 20 wells across three cities, and with WaterAid to provide (CRIT) reservation and CRIT farms. We’re working with the Bonneville water, sanitation, and hygiene access to nearly 9,000 local residents Environmental Foundation to fund the CRIT to suppo爀琀 irrigation in Hyderabad communities. These projects not only suppo爀琀 our infrastructure e昀케ciency by lining a leaky ea爀琀hen irrigation canal— replenishment and water security goals, they also help strengthen reducing seepage loss and water diversion demands in the Colorado public health in the communities that make up an impo爀琀ant pa爀琀 of our River watershed. global workforce. MEXICO CHILE In Mexico City, Google pa爀琀nered with Isla Urbana to provide households Google pa爀琀nered with the Bonneville Environmental Foundation on two that don’t currently have reliable potable water connections to their initiatives to improve watershed health in Chile’s Maipo Basin. We provided homes with a source of easily accessible potable water via rainwater funding to our implementation pa爀琀ner, Kilimo, to scale up precision harvesting and potabilization systems. We also pa爀琀nered with irrigation using AI to suppo爀琀 increased agricultural productivity, maintain Pronatura to suppo爀琀 a comprehensive watershed study along with or improve natural pest control, protect groundwater and su爀昀ace water the implementation of multiple water management practices, resources, and reduce water demand across 260 hectares of farmland. including reforestation, the creation of a percolation pond to increase Google also suppo爀琀ed The Nature Conservancy’s e昀昀o爀琀s to monitor, groundwater in昀椀ltration, and restoration activities to improve soil health. Legend protect, and improve the management of the High Andean wetlands, which o昀昀er many climate and water resilience bene昀椀ts, as well as advocate for its large-scale protection. Land conservation and restoration (7 projects) Aquatic habitat restoration (11 projects) Water supply reliability (7 projects) Water quality (8 projects) Water, sanitation, and hygiene (WASH) (5 projects) 53
Introduction Empowering individuals Working together Operating sustainably Governance and engagement Appendix 2023 Environmental Repo爀琀 Suppo爀琀ing water security with The journey ahead technology While we have a history of responsible water use, 2022 To scale impact, we’ve created tools and case studies marks our 昀椀rst full year of operationalizing our strategy to help others adopt some of the approaches that have Suppo爀琀ing global water security needs collective action. for vulnerable communities, a critical 昀椀rst step to and our water replenishment target. We’ve deployed worked for us, from data center cooling strategies to Global search interest in “water security” more than replacing unsafe water infrastructure. innovative solutions to responsibly manage our water achieving LBC Water Petal ce爀琀i昀椀cation. 103 104 doubled in 2022, reaching a 15-year high in 2022. That’s • Global Water Watch, which aims to democratize footprint, developed internal data infrastructure and • Climate-conscious data center cooling why we’re pu琀琀ing Google’s products and technology in governance models for our replenishment e昀昀o爀琀s with information on water resources. This information will service of helping others study and respond to water security internal operational teams, and identi昀椀ed new, impac琀昀ul • How to achieve LBC Water Petal ce爀琀i昀椀cation empower policymakers, conservation organizations, challenges. We work on ge琀琀ing environmental information organizations to pa爀琀ner with in speci昀椀c watersheds. and communities to be琀琀er manage water resources on the world’s forests, 昀椀sheries, watersheds, and air into the We’re excited about the future of our water stewardship collectively. hands of decision-makers, in suppo爀琀 of our aims to both e昀昀o爀琀s and the impact we’ll have within our own While we still have a long way to go to meet our 2030 address a key need for informed decision-making, and to • American University of Beirut, to apply machine operations, in the communities where we operate, target, we’re proud of our progress this year—replenishing suppo爀琀 e昀昀o爀琀s to scale models and solutions that make learning to weather and agricultural data to improve and for everyonewho relies on clean, fresh water. 6% of our 2022 freshwater consumption. We know water resource information visible and actionable. irrigation for resource-strapped farmers in Africa and challenges lie ahead, including: the Middle East, providing farmers with near-real-time LEARN MORE Google.org has also awarded millions of dollars in grants water use data predictions to conserve the region’s • Navigating the local complexities of watershed health. • Google water stewardship: Accelerating positive to promising water stewardship solutions, including: dwindling water resources. • The limited supply of replenishment projects in many change at Google, and beyond geographies. BlueConduit, to develop publicly accessible tools Additional details can be found in the Empowering • • 3 ways we’re tackling water challenges in India to quantify and map hazardous lead service lines individuals and Working together sections. • Saving water in L.A., one leaky toilet at a time Cooling towers at our data center in St. Ghislain, Belgium. 54
Introduction Empowering individuals Working together Operating sustainably Governance and engagement Appendix 2023 Environmental Repo爀琀 Our ambition Our approach Humans are consuming natural resources Our impact on the circular economy cuts across all our and generating waste at alarming rates. core business operations. It includes the data centers we build and operate to power our products, the workplaces We need 1.75 Ea爀琀hs to sustain our current rate of natural resource consumption, but where Googlers come together to create the next breakthrough technology, and the consumer hardware we only have one planet. 105 The circular products that people use every day. Our impact also economy aims to minimize waste and spans the entire value chain, including data centers, maximize reuse of existing materials. workplaces and stores, products, and our suppliers, and we’ve set goals to measure our progress in each area. An impo爀琀ant component of this is Our ambition promoting safer materials for human and environmental health, to maximize their Our circularity principles focus on designing out waste from the sta爀琀, keeping materials in use for as long as reuse potential. The circular economy Our approach possible, and promoting healthy materials—for our data o昀昀ers a tremendous oppo爀琀unity for centers, workplaces, and products (see Figure 21). new business and innovation, capable of Circular Reducing data center waste generating an estimated $4.5 trillion in new economic output by 2030. 106 Building circular workplaces economy The world can’t achieve net-zero carbon emissions and stores without accelerating the circular economy. Roughly 45% of global GHGs come from embodied carbon emissions, generated from creating new goods and infrastructure. 107 Designing more sustainable We aim to maximize the reuse We can reduce up to 10 GT of carbon by 2050 through consumer hardware products circular strategies, such as using recycled materials and 108 of 昀椀nite resources across our low-carbon building approaches. operations, products, and Working with suppliers To suppo爀琀 the transition to a circular economy, we aim to supply chains become a circular Google—maximizing the reuse of 昀椀nite Enabling others resources across our operations, products, and supply chains and enabling others to do the same. The journey ahead 55
Introduction Empowering individuals Working together Operating sustainably Governance and engagement Appendix 2023 Environmental Repo爀琀 FIGURE 21 Our circularity principles We design out We keep materials in use We promote safe and waste and pollution as long as safely possible healthy materials We design products, workplaces, and data centers with We design for circularity from the sta爀琀, making it easier We pursue strategies to extend the life of our products, healthy materials that are safe for people and for the for the materials used in the creation of our products, workplaces, and data centers for as long as safely possible environment, enabling them to be safely reused in the future workplaces, and data centers to be reused in the future to maximize the use of materials that went into their creation A Google Nest Audio is disassembled. 56
Introduction Empowering individuals Working together Operating sustainably Governance and engagement Appendix 2023 Environmental Repo爀琀 Reducing data center waste TARGET 2022 PROGRESS Achieve Zero Waste to 38% of Google-owned and Land昀椀ll for our global data -operated data centers have center operations achieved Zero Waste to Land昀椀ll DETAILS Year set: 2016 | Base year: N/A | Target year: N/A Scope: Annual operational waste for all Google-owned and -operated data centers globally. “Zero Waste to Land昀椀ll” means that more than 90% of waste is dive爀琀ed from land昀椀ll. When possible, we strive to align measurement of waste diversion at our data centers with the UL Environment Standard 2799 Environmental Claim Validation Procedure for Zero Waste to Land昀椀ll. Storage at Google’s Singapore data center. FIGURE 22 servers for as long as possible, refurbish components Data centers achieving zero waste to land昀椀ll Zero waste to land昀椀ll for future reuse, reuse or resell components following a rigorous security process, and recycle any components Legend In 2016, we announced our aim to achieve Zero Waste that can’t be reused. Still progressing toward zero waste to land昀椀ll goal to Land昀椀ll for our global data center operations. As of Zero waste to land昀椀ll goal achieved the end of 2022, 10 out of 26 (38%) Google-owned and Since 2015, we’ve resold more than 37 million hardware -operated data centers have met this Zero Waste to components from our data centers into the secondary Land昀椀ll target (see Figure 22). For example, our data market for reuse by other organizations, including nearly center in Fredericia, Denmark, achieved Zero Waste to 5 million resold components in 2022 alone. As of the end Land昀椀ll from day one. Our data center waste footprint of 2022, 21% of components used for server deployment, increases as we increase the number of our data centers, maintenance, and upgrades were refurbished inventory. so we continue working towards our target as we grow. In 2022, across our global 昀氀eet of Google-owned and Looking forward, we continue to face challenges for waste -operated data center operations, we dive爀琀ed 86% of diversion at a local level due to the lack of availability of operational waste away from land昀椀lls. recycling infrastructure in some of the rural communities where we operate and inconsistencies in what’s accepted Beyond these goals for land昀椀ll waste, our approach for recycling. to circularity for data center equipment is to maintain 57
Introduction Empowering individuals Working together Operating sustainably Governance and engagement Appendix 2023 Environmental Repo爀琀 Building circular workplaces and stores Building design and construction is one of the largest Circular design and sources of global waste—roughly 30% of all global annual waste comes from building construction and construction 109 demolition. When we design and build Google workplaces and stores around the world, we strive to To make our workplaces more circular, we design deliver on our commitment to accelerating the circular adaptable spaces that can be adjusted over time using economy. fewer renovation materials, we incorporate reuse and material salvage practices, and we provide a rigorous When the right oppo爀琀unity comes up, we pursue model for healthy materials that can be adopted by adaptive reuse projects, renovating existing buildings others. For example, our Bay View and Charleston to serve a new purpose rather than demolishing them East campuses both incorporate salvaged materials for new builds. These reuse projects tend to use fewer into the building design, and both aim to reduce materials, produce less construction waste, and have future renovation waste through highly 昀氀exible and lower embodied carbon. They also preserve community recon昀椀gurable work areas. history, giving historic structures new life as Google workplaces and, in some cases, community spaces, too. For more than a decade, we’ve prioritized building materials that demonstrate safer chemistry to create Some examples include our Playa Vista, California, healthy indoor environments and advance our circularity o昀케ce—a repurposed 1943 airplane hangar, and our goals. One way we promote healthy materials is by Pier 57 o昀케ce in New York City—a historic cruise terminal leveraging third-pa爀琀y standards like the LBC, one of the and transit depot that sat vacant for 20 years before most ambitious green building ce爀琀i昀椀cations in the world. Google reimagined it into an o昀케ce and community space. Our focus on transparency aims to encourage stronger standards in the building industry at large, paving the We also consider adaptive reuse for our data centers, way for others to purchase healthier materials. such as for our data center in Hamina, Finland, which was formerly an abandoned paper mill. We recently opened or advanced several workplace and store projects that re昀氀ect these core principles of circular design and construction (see Figure 23). Our Bay View campus—opened in 2022—also incorporates our circularity principles of designing out waste from the sta爀琀, keeping materials in use for as long as possible, and promoting healthy materials. Learn more in our Pier 57, which served as a historic cruise terminal and transit depot, sat vacant for 20 years before Google reimagined it into an o昀케ce and community space. Bay View spotlight. 58
Introduction Empowering individuals Working together Operating sustainably Governance and engagement Appendix 2023 Environmental Repo爀琀 FIGURE 23 Examples of circular design and construction at our workplaces and stores 237 Mo昀昀e琀琀 Park Drive Charleston East Google store Bolands Mills in Sunnyvale, California, U.S.A. in Mountain View, California, U.S.A. in Dublin, Ireland in Chelsea, New York, U.S.A. Our newest addition to Google’s Sunnyvale In 2022, we advanced construction for our In 2021, we opened our 昀椀rst 昀氀agship retail store Our Bolands Mills o昀케ce is the reincarnation of a campus—237 Mo昀昀e琀琀 Park Drive—is the world’s Charleston East campus, with the goal of in New York City’s Chelsea neighborhood, which 150-year-old 昀氀our mill, repurposed as a workspace largest LBC Materials Petal Ce爀琀i昀椀ed Renovation expanding the boundaries of sustainable design, achieved LEED-ID+C Retail v4 Platinum status. Every for Googlers. There are plans for a public ground- Typology project. The existing building was including around healthy and reclaimed materials. element of the Google Store—the materials, building 昀氀oor food market that will reforge visitors’ transformed into a workplace that embodies Charleston East is on track to achieve LEED-NC processes, mechanical systems and more—was connection to food. With Bolands Mills, we have the regenerative design and promotes well-being. v4 Platinum ce爀琀i昀椀cation and be one of the largest painstakingly considered and selected. For example, oppo爀琀unity to preserve an iconic heritage site while Materials were given a second chance throughout new construction projects ever to a琀琀ain the LBC the veneer on the walls is a so昀琀 gray, responsibly- creating a place that will suppo爀琀 Google and the the building—from still-functioning components Materials Petal Ce爀琀i昀椀cation, which helps ensure sourced hickory, and our custom cork and wood neighborhood for years to come. of the original mechanical systems to roughly 300 the health of the building occupants, the local furniture was created with a local cra昀琀sman from interior doors made with veneer from oak trees community, and the broader supply chain. Using the Greenpoint, Brooklyn. We even a琀琀ached our salvaged from recent California wild昀椀res. In total, LBC Red List as a framework, thousands of materials carpeting (which was manufactured with recycled nearly 3,400 tons of waste (or 91% of total waste on the project went through a rigorous sourcing materials) in a sustainable way. In 2022, we opened our generated) was dive爀琀ed from land昀椀ll during its and review process. The design of Charleston East second retail location in Brooklyn, New York, which construction. also incorporates salvaged materials and Forest also earned a LEED-ID+C Retail v4 Platinum rating. Stewardship Council (FSC)-ce爀琀i昀椀ed wood products. 59
Introduction Empowering individuals Working together Operating sustainably Governance and engagement Appendix 2023 Environmental Repo爀琀 Workplace Operations Our goal TARGET 2022 PROGRESS In 2022, we announced our food waste goal: by 2025, we aim to send zero food waste to the land昀椀ll. Towards Dive爀琀 all food waste from 85% of food waste dive爀琀ed We take a holistic approach to circularity in our o昀케ces, this goal, we aim to cut food waste in half for each sta爀琀ing with designing buildings for zero-waste land昀椀ll by 2025 from land昀椀ll Googler, compared to a 2019 baseline. operations. Not only do we strive to dive爀琀 solid waste from land昀椀lls and incinerators for o昀케ce operations, but We’re on track to cut food waste in half for each Googler we also aim to minimize the amount of materials we use DETAILS and send zero food waste to the land昀椀ll by 2025. In 2022, and maximize their lifespan within our ecosystem and the Year set: 2022 | Base year: N/A | Target year: 2025 we dive爀琀ed 85% of food waste from land昀椀ll, and and surrounding community. We have ambitious targets for Scope: Annual food waste dive爀琀ed from land昀椀ll in kitchens and cafes at Google’s o昀케ces globally. “Zero food we’ve reduced food waste per Googler by 18% since food loss and waste, and we’re working to reduce single- 114 waste to land昀椀ll” is de昀椀ned as 99% diversion of food waste from land昀椀ll via composting, anaerobic digestion, 2019. We’re seeing progress across all operations in use plastics in our operations. or other on-site processing. all regions, across di昀昀erent types of cafes, and by using di昀昀erent intervention levers to spark necessary behavior In 2022, the global land昀椀ll diversion rate for our o昀케ces was 75%. To ensure that what we keep out of land昀椀lls can and operational change. actually be recovered, we prioritize dive爀琀ing high-quality From 2014 through 2021, we prevented nearly 10 million materials and only count non-contaminated recyclable 110 pounds of food from entering land昀椀lls. material. Our focus areas Food waste To fu爀琀her reduce food waste, we’re strengthening our Global searches for “how to reduce food waste” e昀昀o爀琀s in three key areas across our food program: have more than doubled over the most recent 昀椀ve-year 111 period compared to the previous 昀椀ve-year period, • In our kitchen and cafe operations, we’re preventing 112 reaching a 15-year high in 2022. When food waste ends waste from the moment we receive ingredients all the up ro琀琀ing in land昀椀lls, it generates methane—a greenhouse way through to serving a 昀椀nished dish. 113 gas that’s 25 times more potent than carbon dioxide. • At the sourcing and procurement stage, we’re working with our suppliers, distributors, and vendors What’s more, when food goes to waste, so do all of to prevent waste before it happens. the water, energy, and other resources that went into producing it. • When there’s excess food—whether as prepared dishes or plate waste—we’re ensuring it’s donated or To achieve a low-carbon circular economy, we need properly composted. to collectively cut back on food waste. At Google, that means doubling down on our e昀昀o爀琀s to reduce waste in our kitchens, cafes, and overall food operations. In our kitchen and cafe operations, we’re focused on ways to stop food waste before it sta爀琀s. 60
Introduction Empowering individuals Working together Operating sustainably Governance and engagement Appendix 2023 Environmental Repo爀琀 Kitchen and cafe operations Single-use plastics Designing We’re making measurable reductions across back-of- The world’s plastic pollution problem is a large and more sustainable house operations through improved culinary practices complex challenge—more than 91% of plastic isn’t and demand planning to ensure our production levels are recycled, and the majority is le昀琀 si琀琀ing in land昀椀lls or consumer consistent with user dining pa琀琀erns. 115 li琀琀ering our oceans and communities. Reducing plastic waste requires entire industries to come together and hardware products For example, in the United States, we recorded a 22%–30% take more meaningful action. At Google, that means reduction in egg waste by cooking smaller batches, and rethinking our approach to the way we source products, in India we recorded a 50% reduction in per-plate waste serve food, and reduce our waste. Our ambition is to create consumer hardware products following a multi-channel waste reduction campaign. that leave people, the planet, and our communities be琀琀er Sourcing and procurement Improving our plastics footprint isn’t as simple as not than we found them. Our consumer hardware products buying single-use plastics. To reduce single-use plastics include Pixel, Nest, Chromecast, and Fitbit devices. and excess food (upstream) and bridge the infrastructure gaps for recycling and composting (downstream), we need to Since launching our 昀椀rst hardware products, we’ve Additional progress will rely heavily on continued activate the entire food ecosystem, from manufacturers integrated sustainability considerations into materials engagement of our vendor pa爀琀ner operations teams, to distributors to waste management companies. sourcing and science, engineering and supply chain fu爀琀her enabling Googlers to join in, and expanding operations, carbon emissions reductions, waste pa爀琀nerships with municipal and community organizations We do this by working with vendors and suppliers to reduction, packaging products, and designing our to accelerate the pace of food donations and develop avoid or phase out products with single-use plastics; retail stores. compost infrastructure. rethinking how we handle, store, prepare, and serve food and beverages; and using fully recoverable We aim to increase the circularity of our hardware In 2022, to activate industry-wide change, Google materials that are recyclable or compostable. products and operations by decreasing our use of mined provided $1 million in anchor funding to kicksta爀琀 the materials and signaling our demand for a more circular ReFED Catalytic Grant Fund. The ReFED Catalytic Grant We’re piloting and scaling plastic-free processes economy in our procurement of recycled materials. This Fund provides nonpro昀椀t and for-pro昀椀t organizations with and products in our kitchens, cafes, and overall food is in addition to extending the life of our products through recoverable and non-recoverable grants to de-risk and operations. For example, we’re installing beverage so昀琀ware updates and expanded repair options. scale high-impact solutions to food waste. dispensers to replace single-use beverages. We’re rede昀椀ning what we serve—and how we serve it—to We suppo爀琀 greener electronics standards and eliminate single-use plastics and ensure durable, ce爀琀i昀椀cations, including UL 110, IEEE 1680.1, and the UL washable dishware and cutlery are easy to choose. 116 ECOLOGO Program. Looking to the future, we’re also planning to create The aluminum in the phone enclosures of Pixel 5, 6, 6 Pro, 7, food spaces that design out waste from the sta爀琀. and 7 Pro is made with 100% recycled content, reducing the carbon footprint of the aluminum po爀琀ion of the enclosures 117 by over 35% compared to 100% primary aluminum. 61
Introduction Empowering individuals Working together Operating sustainably Governance and engagement Appendix 2023 Environmental Repo爀琀 Recycled materials Using recycled materials can also lower the carbon footprint of our product manufacturing. For example, the TARGET 2022 PROGRESS aluminum in the phone enclosures of Pixel 5, 6, 6 Pro, 7, and Reducing how much waste we generate as a company and 7 Pro is made with 100% recycled content, reducing the Use recycled or renewable 41% of the plastic used in minimizing the demand for new raw materials sta爀琀s with carbon footprint of the aluminum po爀琀ion of the enclosures how we source materials that go into our products. 123 material in at least 50% products manufactured in by over 35% compared to 100% primary aluminum. For more information on recycled material content for each of 124 of plastic used across 2022 was recycled content In 2019, we announced our aim to include recycled our products, see our Product Environmental Repo爀琀s. materials in 100% of Google consumer hardware products our consumer hardware 118 launching in 2022 and every year a昀琀er. We hit our goal While many waste materials can technically be recycled, product po爀琀folio by 2025 early—in 2020—and have maintained it each year since for whether or not they’re actually recycled depends on 119 Nest, Pixel, and Chromecast devices. In 2020, we shared market demand. This is why we’ve strategically prioritized our next steps on this journey. sourcing recycled materials for our products, in hopes DETAILS that increased demand will help maximize the utility of We commi琀琀ed to use recycled or renewable material in at Year set: 2020 | Base year: N/A | Target year: 2025 materials we already use. least 50% of plastic used across our consumer hardware Scope: Includes the minimum percentage of recycled or renewable plastic content calculated as product po爀琀folio by 2025, prioritizing recycled plastic a percentage of total plastic (by weight) in Google’s consumer hardware po爀琀folio for products everywhere we can. 41% of the plastic Google used in 125 manufactured in a given year. 120 products manufactured in 2022 was recycled content. Approximately 30% of the material Google used in its new products launched and manufactured in 2022 was 121 recycled content. This includes recycled material used in our devices’ aluminum, stainless steel, rare-ea爀琀h magnet, glass, and plastic pa爀琀s. 2022 HIGHLIGHT The aluminum in the phone enclosures of Pixel 5, 6, 6 Pro, 7, and 7 Pro is made with 100% recycled content, reducing the carbon footprint of the aluminum po爀琀ion of the enclosures by over 35% compared to 100% primary aluminum. 122 Since the launch of our 昀椀rst hardware products, we’ve worked to improve the sustainability of how we make our products and the services we create around them. 62
Introduction Empowering individuals Working together Operating sustainably Governance and engagement Appendix 2023 Environmental Repo爀琀 Sustainable packaging Product packaging typically contains many materials— 2022 HIGHLIGHT like the plastic 昀椀lm materials you o昀琀en see on electronic packages—which can be di昀케cult to recycle. Packaging for Pixel 7 and 7 Pro uses 128 99% plastic-free materials. That’s why we’re commi琀琀ed to eliminating plastic from our hardware product packaging by 2025. By focusing on 昀椀ber-based materials, we’re enabling consumers to goal. For more information on packaging for each of our more easily recycle our packaging and ensure that the materials will be accepted in as many recycling systems products, see our Product Environmental Repo爀琀s. as possible. Transitioning packaging away from plastic is challenging because many plastic-free alternatives are o昀琀en not We design Nest, Pixel, and Fitbit packaging to minimize available for speci昀椀c packaging needs. We’ll continue to the use of plastic. For new Google products launched work with suppliers to create plastic-free solutions that and manufactured in 2022, our packaging was at least 126 provide durability, protection, and aesthetics. 96% plastic-free, and packaging for Pixel 7 and 7 Pro 127 uses 99% plastic-free materials, ge琀琀ing us closer to this A So爀琀a Sunny color Pixel 6 Pro lies face-down on a table next to a variety of spare pa爀琀s and iFixit-branded repair tools. (Photo cou爀琀esy Andy Miller of iFixit) TARGET 2022 PROGRESS Product longevity updates for 昀椀ve years from when they 昀椀rst become 130 Make product packaging For new Google products available on the Google Store in the United States. And new Chromebooks are built with sustainability in Creating truly sustainable electronics includes cra昀琀ing 100% plastic-free by 2025 launched and manufactured mind, with automatic updates for up to eight years that experiences that guide consumers through the care, keep them running fast and secure. in 2022, our packaging was repair, reuse, and recycling of their products. While there’s much more work to do, we’ve taken some initial steps in at least 96% plastic-free 129 Repairing electronics understanding consumers’ and organizations’ needs and creating new services for them. Providing new ways to repair electronics is an impo爀琀ant DETAILS way to extend their lives. In 2022, we announced our It all sta爀琀s with making sure products last long to begin pa爀琀nership with iFixit to provide genuine Pixel spare pa爀琀s, Year set: 2020 | Base year: N/A | Target year: 2025 with. Enabling security updates and bug 昀椀xes helps tools, and documentation on models as far back as Pixel 2 Scope: Based on the total weight of new Google Pixel, Nest, Chromecast, and Fitbit retail packaging globally promote product longevity. For Google Nest, we issue for users who are skilled in repair and independent service (excluding adhesive materials) for products launched and manufactured in a given year, as shipped by Google. critical bug 昀椀xes and patches for at least 昀椀ve years a昀琀er providers. This pa爀琀nership, alongside our other mail-in launch. Pixel 6 and later Pixel phones will get security 63
Introduction Empowering individuals Working together Operating sustainably Governance and engagement Appendix 2023 Environmental Repo爀琀 and authorized service provider repair channels, lowers E-waste recycling costs and expands the choices customers have in Pixel phone repair. In tandem with our trade-in program, this Since all products will eventually become obsolete, extends the usable life of Pixel phones. availability of and pa爀琀icipation in e-waste recycling In 2022, we announced ChromeOS Flex and the programs is impo爀琀ant to help keep electronics out of Chromebook repair program, which aim to extend land昀椀lls and reuse the critical minerals within them. the useful life of laptops, PCs, and Chromebooks alike. We’re focused on sourcing recycled and sustainable ChromeOS Flex helps extend the life of aging Macs, PCs, materials from our supply chain, and we recognize and Linux devices by conve爀琀ing them to the ChromeOS that the supply chain is only able to provide recycled ecosystem and reducing the amount of e-waste that’s materials when robust recycling collection, processing generated. In addition to providing up to eight years of infrastructure, and technologies are available. For devices so昀琀ware updates for Chromebooks, schools can easily at the end of their service life, we o昀昀er free recycling identify which Chromebooks have commonly repaired in every country where we ship consumer hardware components—like the keyboard, display, and palmrest— 131 products. through our new repair program site. This is just the 昀椀rst step, and we’re looking forward to hearing feedback to help While e-waste recycling programs are generally available, grow and improve the program. they o昀琀en have low consumer pa爀琀icipation rates. That’s why, in 2022, we joined forces with industry peers and We pa爀琀ner with device manufacturers (OEMs) to help electronics recycling sta爀琀up Retrievr on a new e-waste increase the number of new Chromebooks that are made recycling pilot designed to address the behavioral with recycled materials and are easy to customize, repair, reasons that stop consumers from recycling. Unlike and upgrade. For example, the new Framework Laptop recycling household items like food packaging or shipping Chromebook Edition, made of 50% post-consumer boxes, electronics have unique barriers to overcome recycled aluminum, is the most customizable Chromebook before consumers feel comfo爀琀able taking action. The yet. It’s durable, powe爀昀ul, thin, light, and designed to last. goal of the pilot is to study how the industry can reduce Individuals can upgrade the laptop’s memory and storage; barriers and increase pa爀琀icipation in e-waste recycling. replace key pa爀琀s like the screen, ba琀琀ery, and webcam; and swap out the bezel with di昀昀erent colors, all without needing to replace their entire laptop. The Framework Laptop Chromebook Edition is easy to upgrade and repair. 64
Introduction Empowering individuals Working together Operating sustainably Governance and engagement Appendix 2023 Environmental Repo爀琀 with some suppliers to replace shipping materials with proactively manage risk, and new industry pa爀琀nerships Working with suppliers reusable and recyclable alternatives and to redesign that allow us to share best practices intended to packaging to use less material overall. For example, for advance the industry at large. Nest Wi昀椀 Pro, we pa爀琀nered with multiple pa爀琀 suppliers Manufacturing waste in 2022 to replace an estimated 30 metric tons of plastic We continue to enroll suppliers into e-learning courses, 2022 HIGHLIGHT with corrugated cardboard, which is easier to recycle. which more than 250 manufacturing suppliers have Building on these early successes, we’re now engaging completed as of the end of 2022—a number that Half of our consumer hardware Material that’s lost during the product manufacturing more suppliers and comprehensively reviewing packaging continues growing as we extend trainings to more process (o昀琀en called “yield losses”) generates waste in for many more pa爀琀s across our po爀琀folio, in hopes of supplier personnel. 昀椀nal assembly sites achieved 100% our supply chain, so it’s impo爀琀ant to ensure that these identifying more oppo爀琀unities to achieve even bigger land昀椀ll diversion. waste streams are also captured and recycled. In 2020, waste reductions. We’re working to eliminate antimicrobials and use we announced our target to achieve UL 2799 Zero Waste safer 昀氀ame retardants and solvents across our to Land昀椀ll ce爀琀i昀椀cation at all 昀椀nal assembly manufacturing consumer electronics product po爀琀folio. We’re also (representing 100% land昀椀ll diversion). We plan to ce爀琀ify sites for our consumer hardware products by 2022. collaborating across the industry to 昀椀nd and promote the remaining sites in the future. We also aim to maintain Safer chemistry the understanding of safer 昀氀ame retardants available ce爀琀i昀椀cation for 100% of our 昀椀nal assembly sites, including In 2022, we ce爀琀i昀椀ed 90% of our established consumer for the electronics sector. In 2022, we pa爀琀nered with new sites as they’re added. We’re protecting people and the planet through safer hardware 昀椀nal assembly sites to the UL 2799 Zero Waste ChemFORWARD, a trusted nonpro昀椀t source for chemical chemistry and responsible management across our to Land昀椀ll standard. These sites achieved at least Silver hazard data and alternatives, on a proactive approach to We’ve completed a new waste-reduction pilot program hardware products. The chemical safety of materials plays ce爀琀i昀椀cation level (representing a minimum 90% land昀椀ll assessing chemical safety beyond existing regulatory and focused on the packaging materials used to ship product a role in the impact they can have on natural ecosystems, diversion), with half of our sites achieving Platinum level industry norms. We’ve commissioned over 100 chemical pa爀琀s from suppliers to 昀椀nal assembly sites. We worked supply chain workers, and users. hazard assessments and are working to make them Through our Product Restricted Substances Speci昀椀cation available to others through the ChemFORWARD pla琀昀orm. TARGET and Manufacturer Restricted Substances List, we restrict 2022 PROGRESS many hazardous substances and ensure our suppliers Achieve UL 2799 Zero Waste have processes in place to detect and prevent them We achieved UL 2799 Zero from entering the manufacturing process. We’ve laid to Land昀椀ll ce爀琀i昀椀cation at Waste to Land昀椀ll ce爀琀i昀椀cation at a solid foundation as we pursue our next level goals in safer chemistry. all 昀椀nal assembly consumer Silver or higher for 90% of our hardware manufacturing In 2022, we shared more details about our comprehensive established 昀椀nal assembly sites Responsible Chemical Management program that sites by 2022 132 includes assessments, guidance, and training resources to help suppliers be琀琀er mitigate occupational and DETAILS environmental risks related to the chemicals they use. Year set: 2020 | Base year: N/A | Target year: 2022 Recent initiatives have included in-depth assessment Scope: All 昀椀nal assembly manufacturing sites globally for Google consumer hardware products The Nest Thermostat is now made with fewer pa爀琀s programs with greater levels of detail and transparency, with at least one year of data. for a less complicated design. extensive supplier training and guidance materials to more 65
Introduction Empowering individuals Working together Operating sustainably Governance and engagement Appendix 2023 Environmental Repo爀琀 The journey ahead At Google, we believe that realizing a sustainable world The challenge is large, but so is our ambition. We seek means that we must accelerate the transition to a circular to enable others to embrace circularity, which is why we economy where people, the planet, and businesses thrive. share knowledge and insight through research, product This is a large and complex global challenge, but we’ve examples, and case studies with our pa爀琀ners, customers, always viewed a challenge as an oppo爀琀unity to be helpful and billions of users around the world. Examples include: and make things be琀琀er for everyone. • Closing the plastics circularity gap While we’re excited about our journey to a circular • Understanding barriers to electronics recycling economy, we recognize that we’ll face many challenges along the way. For example: • Accelerating commercial deconstruction and reuse • Recovering and dive爀琀ing resources from land昀椀lls Our goal with this work is to accelerate progress towards requires robust collection and recycling infrastructure a fully sustainable technology industry and real estate around the world, beyond what exists today. footprint operating on clean, e昀케ciently used energy and A Googler swaps out a motherboard at our data center in The Dalles, Oregon. When server pa爀琀s break, • The lack of 昀椀nancially healthy end markets and local made with safe and circular materials. reuse infrastructure for salvaged resources o昀琀en we 昀椀rst try to repair them. If we can’t, we break them up into raw materials and recycle the components. prevents or prohibits materials from making their way LEARN MORE back into the economy. • How Google is suppo爀琀ing the circular economy Enabling others • The circular economy requires be琀琀er data to enable markets to identify, manage, and value available • A new accelerator for circular economy sta爀琀ups resources. More and higher-quality data is needed to and nonpro昀椀ts The circular economy requires everyone to pa爀琀icipate to using AI technology for waste identi昀椀cation. Our goal inform capital investments, infrastructure priorities, • Restricted substances speci昀椀cation with CircularNet is to develop a robust and data-e昀케cient to reach its fullest potential. That’s why we’re focused on business plans, policies, and other interventions. model for waste/recyclables detection, which can suppo爀琀 sharing insights about our e昀昀o爀琀s so others can adopt • Accelerating the switch from using single-use plastics the way anyone in the waste management ecosystem can them, and why we invest in creating technologies that to more reusable solutions requires additional identify, so爀琀, manage, and recycle materials. enable everyone to have an impact. innovation with the potential to scale across large real estate po爀琀folios. We also suppo爀琀 our pa爀琀ners to help discover, accelerate, For example, in 2022, we introduced product features and scale ecosystem solutions that can bene昀椀t everyone • We’re exploring the connection between low-GHG that help people and businesses recycle clothing and tackling waste and reuse challenges. In 2022 and early construction materials and the circular economy, other goods, and that help hardware customers keep 2023, we worked to jumpsta爀琀 pa爀琀ner innovation by recognizing that recycled materials o昀琀en have lower their products in use longer. We’re also helping to improve 133 launching multiple accelerators focused on circular carbon footprints than virgin resources. recycling through accurate measurement and data-led economy solutions. Additional details can be found in the insights using machine learning. In 2022, we shared details Working together and Empowering individuals sections. about CircularNet, a set of models that lowers barriers 66
Introduction Empowering individuals Working together Operating sustainably Governance and engagement Appendix 2023 Environmental Repo爀琀 Our ambition Our approach The world has seen an average loss of We strive to protect and enhance nature and biodiversity through our campuses and technology. 69% of mammal, bird, 昀椀sh, reptile, and 134 amphibian populations since 1970, and climate change, water stress, and resource Google has o昀케ces in nearly 60 countries around the world (as of year-end 2022). In these locations, we aim to protect depletion are only accelerating the stress and enhance nature and biodiversity through a four-pillar on our natural environment. Roughly half approach that sta爀琀s with building biodiversity at our own of global GDP—or $44 trillion—depends o昀케ce and campus developments, as well as protecting on nature and its services, such as healthy nature and making it more accessible in the surrounding communities where we operate (see Figure 24). soils, 昀氀ood prevention, clean water, nutrient cycling, pollination, and a stable climate. 135 Our approach fu爀琀her focuses on sourcing responsibly Our ambition across our supply chain. And our billions of users have the Preserving nature is critical both to mitigating climate potential to have a positive impact on their environments change and adapting to it. We want nature and people to if given the information and tools to do so, so we’re also 昀氀ourish together in the communities that Google calls Our approach developing technology to help increase nature’s resilience Nature and home, as well as the ecosystems where we source food to climate change. for the hundreds of cafes we operate. biodiversity Building for biodiversity FIGURE 24 Our approach to nature and biodiversity Protecting nature and making it more accessible We strive to protect and enhance Sourcing responsibly nature and biodiversity through Building for Protecting nature and Sourcing Developing technology to Developing technology to biodiversity making it more accessible responsibly address biodiversity loss our campuses and technology address biodiversity loss We build for biodiversity In the Bay Area and elsewhere We’re focused on sourcing We’re creating pla琀昀orms, on-site at Google o昀케ces across our po爀琀folio where responsibly across our supply open tools, and geospatial and campuses by designing appropriate, we nu爀琀ure the chain by procuring sustainable and AI-powered solutions The journey ahead for ecology and bringing environment and connect building and hardware that help to increase nature’s nature back to cities. people to nature, both on our materials and suppo爀琀ing resilience to climate change campuses and in the biodiverse food systems. and address the causes of surrounding communities. nature loss. 67
Introduction Empowering individuals Working together Operating sustainably Governance and engagement Appendix 2023 Environmental Repo爀琀 publication of a public version that’s freely available for 2022 HIGHLIGHT landscape managers in public, private, and NGO se琀琀ings. In Building for biodiversity addition, our ecology team also issues guidelines on native As of the end of 2022, we’ve created landscape maintenance, pollinator habitats, bird bath and and restored more than 40 acres of Centuries of agricultural intensi昀椀cation and urbanization campuses. In collaboration with local NGOs, ecology nest design, plant pathogen prevention, and recycled water have transformed landscapes and native habitats around expe爀琀s, and government agencies, this work spans from habitat on Google’s campuses and use for native plants. All Bay Area ground-up construction the world, including a loss of over 99% of native habitats in creating welcoming habitat patches for pollinators to the surrounding urban landscape, projects completed in 2022 incorporated bird-friendly 136 Silicon Valley. Google is working to bring nature back into pa爀琀nering on larger projects like restoring the Charleston primarily in the Bay Area. design elements to reduce the risk of window collisions. the built environment—in pa爀琀, by restoring critical habitats Retention Basin. Together, these e昀昀o爀琀s drive landscape- like oak woodlands and willow groves across our Bay scale restoration of historical ecosystems like oak In 2022, we opened Bay View, the 昀椀rst major campus Area campuses. Our aim is to revive the area’s ecological woodlands, willow groves, and creek and wetland habitats The guidelines help landscape designers leverage plant designed by Google, and the most comprehensive heritage and bolster the human experience while (see Figure 25). choices and layout to maximize wildlife habitat value. They example yet of our approach to designing for ecology. creating thriving, functional landscapes for a biodiverse include detailed guidelines on native plant pale琀琀es, planting Bay View features over 17 acres of high-value natural constellation of species. In the Bay Area and beyond, We’ve established landscape design practices that ensure structure and density, plant requirements, maintenance areas—including wet meadows, woodlands, and a marsh— wherever possible, we strive to build biodiversity on-site ecologically-designed landscapes thrive over the long term, requirements, and bird-safe practices. To promote wider designed to reestablish native landscapes and rehabilitate at Google o昀케ces and campuses by designing for ecology primarily through our internal Habitat Design Guidelines. use and impact of these guidelines, we sponsored the Bay Area wetlands. Learn more in our Bay View spotlight. and bringing nature back to cities. FIGURE 25 Designing for ecology How we’re restoring native habitats in Silicon Valley We increase native, biodiverse habitats on our development sites through both large- and small-scale e昀昀o爀琀s that prioritize local species. For example, we contributed to the restoration of the Charleston Retention Basin near our 137 Bay Area campuses, including nearly 6 acres of new and enhanced freshwater marsh, native upland, and riparian communities, and we continue to protect a rookery that’s regionally impo爀琀ant for the local egret population. In 2022, we created nearly 5 acres of new habitat on our campuses for monarch bu琀琀e爀昀lies and other pollinators. As of the end of 2022, we’ve created and restored more than 40 acres of habitat on Google’s campuses and the surrounding urban landscape, primarily in the Bay Area—including 17 acres at our Bay View campus. We’ve also planted roughly 4,000 native trees on our Bay Area 68
Introduction Empowering individuals Working together Operating sustainably Governance and engagement Appendix 2023 Environmental Repo爀琀 Bringing nature back to cities Restoring habitat for monarch bu琀琀e爀昀lies We’re also bringing nature back to many cities where we operate. Global search interest in “pollinators” and We’re taking steps to help address the threat facing “tree planting” reached all-time highs in 2022. 139 California’s monarch bu琀琀e爀昀lies—pollinators that are impo爀琀ant to our ecosystem. In 2020, California only saw In urban areas around the world, we’re designing nature 2,000 monarch bu琀琀e爀昀lies during the winter: a more than into the built environment to improve urban biodiversity 90% decline from the millions of monarchs that visited the and connect people to nature. For example, our Pla琀昀orm G 138 state in the 1980’s and 1990’s. building in London’s King’s Cross neighborhood will include Given our signi昀椀cant presence in California, in 2021, a biodiverse green roof and planting pale琀琀e designed to suppo爀琀 native birds, bats, bees, and insects, designed we announced our aim to suppo爀琀 the creation, in collaboration with the London Wildlife Trust. A densely restoration, and/or enhancement of 600 acres of habitat planted outdoor roof garden with a rainwater irrigation for monarchs and other pollinators across California, system will provide a habitat for protected species of including creating more habitat on our campuses. We’ve bats and birds, as well as o昀昀ering a quiet green space for put $500,000 toward this e昀昀o爀琀 on our campuses, and breaks during the work day. We’re collaborating with the Google.org granted another $500,000 to the Xerces London Wildlife Trust as pa爀琀 of a wider initiative to protect Society and Peninsula Open Space Trust for habitat work our native species and improve local biodiversity. across the state. In city centers lacking greenspace, the urban heat island To date, this has helped to restore and enhance more e昀昀ect produces higher temperatures, leading to increased than 500 acres of monarch and pollinator habitat across 140 energy needs, air pollution, and heat-related illness. California, including creating nearly 5 acres of new habitat Google is helping to abate the urban heat island e昀昀ect on our campuses in 2022. by prioritizing plantings, green open spaces, and tree canopy cover on our campuses, as well as reducing impermeable su爀昀aces like concrete. 2022 HIGHLIGHT We published insights from some of this work in an We’ve provided grants to help academic paper, aiming to inspire others and provide them restore and enhance more than with tools and techniques for integrating nature into dense urban areas. 500 acres of monarch and pollinator habitat across California. A monarch bu琀琀e爀昀ly at our Charleston East campus. (Photo: Rick Miskiv for Google) 69
Introduction Empowering individuals Working together Operating sustainably Governance and engagement Appendix 2023 Environmental Repo爀琀 Some recent buildings that re昀氀ect this approach to • Pier 57 (New York, NY): biophilic design include: In 2022, we opened Pier 57 in New York City, which Protecting nature and making it incorporates water views and plantings throughout more accessible • Bay View (Mountain View, CA): the building to suppo爀琀 biophilic design. With an abundance of biophilic design elements from • Mo昀昀e琀琀 Park (Sunnyvale, CA): natural light to accessible trails, our Bay View campus We recognize that our campus landscapes exist as pa爀琀 In Sunnyvale, we’re building our 昀椀rst ground-up mass Connecting communities was a 昀椀nalist for the 2023 Stephen R. Kelle爀琀 Biophilic of greater natural ecosystems, so it’s impo爀琀ant that timber building, which will incorporate biophilic design Design Award, presented by ILFI to recognize leading we work to protect and suppo爀琀 nature—and make it principles by exposing the natural timber structure to and nature examples of biophilic design in the built environment. more accessible to people—both on our campuses and building occupants, and by providing abundant views Learn more in our Bay View spotlight. across the broader communities where we operate. and daylight throughout the interior. We invest for the long term, so we want to care for the In the Bay Area and elsewhere across our po爀琀folio environments and communities where we operate. where appropriate, we nu爀琀ure nature by suppo爀琀ing We engage with local communities and leading restoration e昀昀o爀琀s beyond our campuses and by planning programming that extends the bene昀椀ts of nature to all. for resilience. We also connect people and nature by For example, in pa爀琀nership with the Santa Clara Valley providing community access to nature and improving Audubon Society, the City of Mountain View, and other worker health through biophilic design. organizations, Google hosts “Egret O昀케ce Hours” at the Shorebird Way rookery so the public can safely see moments throughout the egret breeding cycle. Nu爀琀uring nature across ecosystems As another example, we created the Green Loop, a publicly accessible pedestrian and cycling trail connecting some of our buildings in Mountain View. The Green Loop We invest in restoration projects outside of Google’s was designed with native vegetation to enhance habitats campuses to build health across the wider ecosystem for pollinators and other wildlife (including nearly 100 and accelerate our water stewardship goals. In addition native trees), as well as to help manage stormwater. to grants mentioned above to create and maintain pollinator habitat, we also suppo爀琀 e昀昀o爀琀s to strengthen We ensure that Googlers have access to the bene昀椀ts the ecological resilience of critical natural systems like the San Francisco Bay. In 2022, we pa爀琀nered with the of high-quality biodiverse nature through incorporating exterior landscapes and access to nature on our San Francisco Estuary Institute to create the Shoreline campuses, as described above. We also focus on bringing Resilience Framework for Wildlife Suppo爀琀, which is being a琀琀ributes of natural environments into our interior spaces used by regional agencies to identify, map, and enhance by applying biophilic design practices, such as nature- functions that contribute to shoreline resilience. These inspired architecture, interior, and landscape design. To functions may include protecting the shoreline from fu爀琀her this, we collaborated on an initiative with the ILFI to erosion, suppo爀琀ing threatened and endangered species, make a Biophilic Design Toolkit that was launched in 2022 The Shorebird Way rookery on our Mountain View, California campus re昀氀ects a broader e昀昀o爀琀 to design and maintaining critical landscape processes like marsh and is freely available for anyone to use. and build our o昀케ces with local environments, ecology, and animal habitats in mind. migration with sea-level rise. 70
Introduction Empowering individuals Working together Operating sustainably Governance and engagement Appendix 2023 Environmental Repo爀琀 aim to engage our users in nature-related tools, product Sourcing Developing technology to address features, and information. For example, Google Shopping restricts the sale and trade of endangered species via responsibly biodiversity loss content moderation policies. Additionally, we provide free API access to our Maps and Places products for some nature-related uses, such as the iNaturalist app, which We’re focused on sourcing responsibly across our supply We build tools and technology that enable pa爀琀ners, solution that improves supply chain transparency. We helps people learn more about their local environment. chain by procuring sustainable building and hardware NGOs, governments, and academics around the world also use AI to help pa爀琀ners unlock new advances, such materials and suppo爀琀ing biodiverse food systems. to help address nature and biodiversity loss. Our most as our machine learning model that helps the scienti昀椀c Additional details on how we’re developing breakthrough impac琀昀ul technology in this area is Google Ea爀琀h Engine, community in detecting humpback whale sounds, or in technologies to address nature and biodiversity loss We procure building materials for development projects a leading technology pla琀昀orm for planetary-scale 昀椀nding hopeful signs of wildlife recovery a昀琀er wild昀椀res. can be found in the Working together and Empowering and hardware materials for products aiming to minimize environmental monitoring such as land use change, the individuals sections. negative impacts on global biodiversity. For example, for most signi昀椀cant driver of biodiversity loss. Additionally, While suppo爀琀ing expe爀琀 pa爀琀ners is impo爀琀ant, we also new campus developments, we’ve incorporated timber we’ve helped launch other pla琀昀orms that help protect believe technology should help everyone do their pa爀琀 for ce爀琀i昀椀ed by the Forest Stewardship Council (FSC)—the nature, such as TraceMark, a sustainable sourcing nature and biodiversity. That’s why many of our products world’s leading forest ce爀琀i昀椀cation system for sustainable wood building materials. The 昀椀rst time Google led the concept and construction of our own major campuses, Google and our development pa爀琀ners prioritized FSC ce爀琀i昀椀cation of all new wood purchased and installed, achieving over 96% FSC-ce爀琀i昀椀ed wood at Bay View. 141 Our e昀昀o爀琀s earned us a 2021 FSC Leadership Award, which recognizes excellence in responsible forest management and conservation. We work to ensure our food operations contribute positively to global biodiversity. Across our cafes, our Food team is focused on increasing the propo爀琀ion of agrobiodiverse crops featured on our menus. We leverage procurement practices and menu design to replace monocrop commodities with climate- resilient crops, and jump-sta爀琀 local markets to suppo爀琀 agrobiodiversity. In addition to agrobiodiversity, we also suppo爀琀 regenerative agriculture practices. This work builds on the Food team’s vision of helping to feed the world responsibly and sustainably. We’ve incorporated timber ce爀琀i昀椀ed by the Forest Stewardship Council (FSC) in our new campuses developments. 71
Introduction Empowering individuals Working together Operating sustainably Governance and engagement Appendix 2023 Environmental Repo爀琀 The journey ahead Our approach to protecting nature has impo爀琀ant co- Our research papers, a爀琀icles, and toolkits are intended bene昀椀ts. Protecting nature helps sequester carbon, to help others adopt some of the approaches that have and sequestering carbon helps preserve nature. Water worked for us, from restoring native habitats to integrating stewardship helps nature thrive, and thriving ecosystems nature into cities. suppo爀琀 water stewardship. By promoting circularity, we’re • Habitat design guidelines reducing the extraction of natural resources, which in turn • Biophilic Design Toolkit protects against environmental degradation—a direct driver of biodiversity loss. For that reason, we’ll seek to • Toolkit for suppo爀琀ing nature in cities evaluate these e昀昀o爀琀s with a more holistic view. • Integrating nature into urban areas While we’re excited about our work to protect and Moving ahead, we’ll continue to build pa爀琀nerships with enhance nature and biodiversity through our campuses others, using lessons from our own e昀昀o爀琀s alongside new and technology, we recognize that we face some tools and technology to help everyone take action. challenges, including: LEARN MORE • Navigating the local complexities of biodiversity and ecosystem health, as well as forging a broad set of • Seeding resilience with ecology pa爀琀ners to ensure collective action. • Doing our pa爀琀 for California’s monarch bu琀琀e爀昀lies • Feeding a global workforce responsibly and • AI reveals signs of recovery in areas devastated by sustainably while suppo爀琀ing agrobiodiversity and bush昀椀res regenerative agriculture practices. • Map of Life Indicators adopted in UN Biodiversity • Procuring healthy materials for our campuses and Framework products while encouraging manufacturing pa爀琀ners to embrace responsible material sourcing practices. • Expanding the nature and biodiversity practices that work in one region to more of the areas where we operate around the world. • E昀昀ectively measuring nature and biodiversity. In 2022 we opened Pier 57 in New York City, which incorporates water views and plantings throughout the building to suppo爀琀 biophilic design. 72
Introduction Empowering individuals Working together Operating sustainably Governance and engagement Appendix 2023 Environmental Repo爀琀 In 2022, we opened Bay View in Mountain predictive models. This integrated geothermal pile SPOTLIGHT system also enabled us to electrify the building’s overall View, California, the 昀椀rst major campus Building a more sustainable developed by Google. From the sta爀琀, systems more e昀昀ectively, because recycling ground heat we had big ambitions for this project: requires less energy than creating new heat. Bay View re-envisioning the workplace with a focus also features our largest electric kitchen, through which we’re learning lessons that will inform the transition of all campus in Mountain View on prioritizing the human experience and our kitchens to electric cooking. community-centered development. Water stewardship Bay View has now achieved LEED Platinum ce爀琀i昀椀cation To help address local water scarcity, Bay View is on track and is on track to be the largest project to a琀琀ain LBC to meet the LBC’s de昀椀nition of “net water positive,” Water Petal Ce爀琀i昀椀cation, two of the world’s most meaning it’s designed to produce more recycled water ambitious building standards. These achievements re昀氀ect than the site requires. Predictive models estimate that our goal of building sustainability into everything at Bay the on-site geothermal energy system is expected to View: it integrates low-carbon design, helps regenerate help reduce about 90% of the water needed for cooling, local ecosystems, incorporates circularity principles, and compared with a traditional cooling tower system. To is on track to achieve net water-positive status. fu爀琀her reduce water use, we designed the campus landscapes with native plants and drought-tolerant Net-zero carbon species that don’t require as much watering. Bay View is a fully electric campus with on-site solar energy and nearby wind farms that are expected to help We’re also capturing and reusing water on-site when it operate on 90% clean energy. It features a 昀椀rst-of-its- possible. Stormwater retention ponds and constructed kind dragonscale solar roof across all three buildings, wetlands for wastewater treatment were integrated into which use the latest building-integrated photovoltaic the site landscape. A central plant treats stormwater technology. Unlike a 昀氀at roof, where each panel gathered from retention ponds and wastewater collected generates peak power at the same time of the day, the from buildings, producing recycled water that can be roof’s unique shape enables it to generate power during used for cooling towers, 昀氀ushing toilets, and irrigation. an extended number of daylight hours. Circular economy To heat and cool the buildings, Bay View houses an Bay View incorporates our circularity principles of innovative geothermal energy system, which is expected minimizing waste, keeping materials in use for as long as to help reduce the building’s carbon emissions compared possible, and promoting healthy materials that are safe An interior photo of the canopy ceiling at our Bay View campus. (Photo: Iwan Baan) with a conventional, code-compliant baseline, per our for people and the environment. We’ve dive爀琀ed 76% 73
Introduction Empowering individuals Working together Operating sustainably Governance and engagement Appendix 2023 Environmental Repo爀琀 of construction waste from land昀椀ll, and over 96% of all design principles to the interior spaces, aiming to capture 142 new timber used in the campus is ce爀琀i昀椀ed by the FSC, proven health bene昀椀ts for workers through approaches earning us a 2021 FSC Leadership Award. We designed such as clerestory windows, which provide access to 昀氀exible workspaces, including easily adjustable pa爀琀ition natural light from every work area. Due to these e昀昀o爀琀s, walls, reducing the need for new materials as our needs Bay View was a 昀椀nalist for the 2023 Stephen R. Kelle爀琀 evolve. And we ve琀琀ed thousands of materials against the Biophilic Design Award. LBC’s “Red List” to avoid toxins and create the healthiest environment possible, from the carpet tiles and paints to Replicable solutions the plywood and furniture. From the sta爀琀 of this project, we aimed to create shared value through replicable solutions and innovations that Nature and biodiversity could bene昀椀t others and drive innovation forward. Bay View is the most comprehensive example yet of our The dragonscale roof taught us how to integrate solar approach to designing for ecology. The site was designed panels into a building skin in ways that we believe can to integrate with the native landscape and regenerate help standardize this practice. The on-site wastewater local ecosystems such as wetlands. It features over treatment system can hopefully make it easier for 17 acres of high-value natural areas—including wet others in the area to design similar systems by paving meadows, woodlands, and a marsh. the way for local codes to evolve. And our strategies to minimize construction waste involved working closely The signi昀椀cant amount of open space was though琀昀ully with manufacturers to reduce packaging, an e昀昀o爀琀 we designed to echo pre-development water 昀氀ows through believe could help others with similar goals. To share stormwater treatment areas, which include open- our learnings and help raise awareness across the water ponds that provide a habitat for aquatic wildlife. development industry, we released a book outlining all New willow groves provide a critical habitat for local these innovations, in the hopes of ultimately expanding wildlife and migrating songbirds, which have almost the impact of this project around the world. entirely disappeared from the South Bay. Additionally, pollinator gardens help the campus meet the LBC’s urban LEARN MORE agriculture criteria, recognizing the key role of native • Bay View and Charleston East pollinators—such as bees—in local food production and ecosystem health. • Pathways: Unlocking innovation at Bay View and Charleston East Bay View provides Googlers and community members with access to nature through landscape restoration The outdoor cou爀琀yard between two primary buildings at our Bay View campus shows and accessible trail networks. We also applied biophilic Google’s focus on connecting employees with nature. (Photo: Iwan Baan) 74
Introduction Empowering individuals Working together Operating sustainably Governance and engagement Appendix 2023 Environmental Repo爀琀 About Google Governance Sustainability governance and Risk management Stakeholder engagement engagement Public policy and advocacy Pa爀琀nerships Awards and recognition 75
Introduction Empowering individuals Working together Operating sustainably Governance and engagement Appendix 2023 Environmental Repo爀琀 About Google As our founders explained in their 昀椀rst le琀琀er to shareholders, Google’s goal is to “develop services that signi昀椀cantly improve the lives of as many people as possible.” We believe in technology’s potential to have a positive impact on the world. That unconventional spirit has been a driving force throughout our history, inspiring us to tackle big problems and invest in moonshots, such as our long- term oppo爀琀unities in AI. We continue this work under the leadership of Alphabet and Google CEO Sundar Pichai. Alphabet is a collection of businesses—the largest of which is Google. Google comprises two segments: Google Services and Google Cloud. Google Services’ core products and pla琀昀orms include ads, Android, Chrome, hardware, Gmail, Google Drive, Google Maps, Google Photos, Google Play, Search, and YouTube. Our The Googleplex in Mountain View, California consumer hardware includes Fitbit wearable devices, Google Nest home products, and Pixel devices. Our Google Cloud o昀昀erings include Google Cloud Pla琀昀orm The Sustainability Focus Area includes the Chief and Google Workspace. Sustainability governance Sustainability O昀케cer and executives from across the company with diverse skills, from teams such Our headqua爀琀ers are located in Mountain View, as operations, products, 昀椀nance, marketing, legal, California. We own and lease o昀케ce facilities and data communications, and policy, among others. Through Alphabet’s Board of Directors has delegated to the Audit In 2022, Google evolved its approach to sustainability centers around the world, primarily in No爀琀h America, the Sustainability Focus Area, sustainability and climate and Compliance Commi琀琀ee the primary responsibility for governance by creating a Sustainability Focus Area, an Europe, and Asia. To learn more, see our data center ambitions are built into our company-wide goals, plans the oversight of many of the risks facing our businesses. The internal team led by our SVP of Learning and Sustainability locations and our o昀케ce locations. of action, management policies, pe爀昀ormance objectives, Audit and Compliance Commi琀琀ee reviews and discusses that provides centralized management oversight of and how we monitor progress. with management any major risk exposures, including sustainability and climate-related issues. sustainability risks, and the steps that Alphabet takes to detect, monitor, and actively manage such exposures. 76
Introduction Empowering individuals Working together Operating sustainably Governance and engagement Appendix 2023 Environmental Repo爀琀 risk perils such as heat stress, water stress, hail, tropical To identify and assess water-related risks in our supply Risk management cyclones, tornadoes, droughts, wild昀椀res, and wind gusts. chain, we’ve conducted a supply chain water use analysis We also considered risks associated with transitioning and a supplier risk assessment using WRI’s Aqueduct to a low-carbon economy (e.g., energy costs, future Water Risk Atlas, WWF’s Water Risk Filter, and WULCA regulations, technology, market, and reputational risks, AWARE. The key risks identi昀椀ed included baseline water Our Enterprise Risk Management (ERM) team is responsible aspects of climate resilience within Google, as well as the among a few). We also assessed numerous climate- stress, 昀氀ood risk, access to safe drinking water, and the for identifying, assessing, and repo爀琀ing risks related to internal and external actors who either in昀氀uence or are related oppo爀琀unities such as building and expanding level of sanitation and hygiene services. This assessment the company’s operations, 昀椀nancial pe爀昀ormance, and in昀氀uenced by Google’s climate resilience decisions. These climate solutions to suppo爀琀 users’ journeys to a low- enabled us to identify priority locations for supplier reputation. As with 昀椀nancial, operational, and strategic ideas continue to inform how we think about addressing carbon world, improving o昀케ce and data center e昀케ciency, engagement in Central America, Asia, and the risks, the team assesses environmental risks as pa爀琀 of the long-term climate risk. and advancing new energy e昀케cient technologies. United States. company’s overall risk management framework. The risks and oppo爀琀unities identi昀椀ed through this process suppo爀琀 In 2020, Google conducted a climate risk assessment, To safeguard the health of local waterways, we stipulate public disclosures and inform Google’s environmental which included a low and high emissions climate scenario Water-related that suppliers “[treat water] as required prior to discharge sustainability strategy. Our Chief Sustainability O昀케cer and analysis. This assessment modeled the impact of 昀氀ooding, or disposal of all wastewater.” To suppo爀琀 the health and sustainability teams work to address risks by identifying water stress, extreme heat, and wild昀椀res on 26 priority risks wellbeing of those in the communities we operate in, oppo爀琀unities to reduce the company’s environmental o昀케ce sites and 23 data center locations. The key result suppliers must “provide workers with ready access to impacts from its operations and value chain, and through of this scenario analysis was that increased exposure to To identify and assess water-related risks in our direct clean toilet facilities [and] potable water.” We conduct improving climate resilience. extreme heat and 昀氀ooding is likely to impact many of our operations, Google annually unde爀琀akes a water risk regular supplier audits to monitor adherence to our global o昀케ces and data centers as early as 2030, if not assessment to identify priority locations with potential code of conduct. Additionally, we’ve engaged our sooner. We consider these results when planning Google’s water-related risks that may present oppo爀琀unities for suppliers through the CDP Supply Chain Water Security overall development strategy. Climate-related water stewardship action. Indicators from available risk questionnaire, inviting them to disclose their water assessment tools, including WRI Aqueduct Water Risk management e昀昀o爀琀s. In 2022, Google increased its e昀昀o爀琀s to align our risks Atlas 3.0 and WWF Water Risk Filter 6.0, are blended climate risk assessment process more closely with the recommendations of the Task Force on Climate- with other metrics to evaluate risks related to scarcity, 昀氀ooding, water quality, sanitation and hygiene, reputation, Climate-related risks and oppo爀琀unities have long time Related Financial Disclosures (TCFD), leveraging and regulatory stressors. horizons with high unce爀琀ainty regarding how climate the TCFD categories of risks and oppo爀琀unities and trends, policy, and socio-economic factors might evolve conducting climate scenario analyses. In an e昀昀o爀琀 to drive For our data center operations speci昀椀cally, in 2022 in the future. Google continues to build on qualitative completeness and consistency when reviewing these Google 昀椀nalized the development and application of a and quantitative risk assessments to identify climate- categories, we adopted our ERM rating scales (i.e., impact, context-based water risk and impact methodology to related risks and oppo爀琀unities, and to understand their frequency, likelihood, control e昀昀ectiveness) to identify generate more granular insights than can be provided associated impact. and prioritize areas of focus. by water risk screening tools. It provides a framework to measure and evaluate site-level water risks, and the In 2015, Google developed a set of Principles of Climate In 2022, climate-related risks and oppo爀琀unities were potential watershed impact, to inform our decision- Resilience, which suppo爀琀 our de昀椀nition of climate risk analyzed in three time horizons—sho爀琀 term (through making process for new site selection, water cooling and resilience. From there, we created a framework that 2030), medium term (through 2040), and long term The cooling towers at our Mayes County, Oklahoma data design, and ongoing operations. prioritizes the impact on people (including communities, (through 2050)—for 昀椀nancial, operational, legal, and center help keep our servers running e昀케ciently. users, and Googlers), so that it represents the di昀昀erent strategic risks. We considered acute and chronic physical 77
Introduction Empowering individuals Working together Operating sustainably Governance and engagement Appendix 2023 Environmental Repo爀琀 Google’s Supplier Code of Conduct includes requirements severe issues immediately. We expect all other 昀椀ndings to Stakeholder engagement that enable us to ensure that those we pa爀琀ner with are be resolved in accordance with our guidelines as quickly responsible environmental stewards. Along with having as is practical. While we work with our suppliers to help suppliers evaluate their operations, we pe爀昀orm our own them address our 昀椀ndings, in some instances, we may ongoing due diligence and audits to verify compliance and decide to no longer pursue a relationship or to terminate We believe in the impo爀琀ance of outside perspectives business more sustainably. Throughout the year, we to understand our supply chain’s current and potential risks. our current relationship. to help inform our business decisions. We actively invite thought leaders and expe爀琀s to speak about the engage with our stakeholders (e.g., employees, NGOs, latest sustainability trends, and we post some of these When we 昀椀nd that a supplier isn’t complying, we expect In 2022, we audited a subset of our suppliers to verify policymakers, customers, researchers, academics, talks publicly on our Talks at Google YouTube channel. that supplier to provide a corrective action plan (CAP) that compliance for the following environmental criteria: and investors) throughout the year on a broad range of Employees can also access online sustainability courses outlines the root cause of the 昀椀nding, how and when that implementation of environmental management environmental topics. and can join global and local internal community groups company will resolve the issue, and what steps it will take systems, environmental permits and repo爀琀ing, product focused on sustainability topics. Some employees Our engagement enables us to be琀琀er understand also take on a 20% project—an oppo爀琀unity to work to prevent recurrence. We determine whether the plan is content restrictions, and resource e昀케ciency, as well as acceptable based on the severity of the noncompliance management of hazardous substances, wastewater, our stakeholders’ perspectives, elaborate on our on something outside of their primary role—related and the e昀昀o爀琀 and time required to resolve the issue. solid waste, and air emissions. environmental strategy, and progress against key targets, to sustainability. One great example of this is Project We expect suppliers to demonstrate improvements to and it creates a vital two-way dialogue that informs our Sunroof, which began as a 20% project back in 2015. continue working with us. Our goal is to resolve the most approach to the work. Lastly, employees have the oppo爀琀unity to learn about sustainability through internal newsle琀琀ers and education See below for more information on how we engage campaigns. with employees, suppliers, policymakers, and pa爀琀ners. For additional information on how we collaborate with customers, researchers, academics, and NGOs, see the Supplier Working together section. engagement Employee Through our supplier responsibility program, we’re working to build an energy-e昀케cient, low-carbon, engagement circular supply chain that makes sma爀琀 use of the Ea爀琀h’s resources, protects ecosystems, and helps to combat Sustainability is pa爀琀 of our culture, and we give our climate change. We focus on the areas where we can employees oppo爀琀unities to engage on environmental make an immediate and lasting impact, such as helping issues and put their passions into practice. our suppliers improve their environmental pe爀昀ormance and integrate inclusivity, climate resilience, water To celebrate Ea爀琀h Day, we host an annual vi爀琀ual event stewardship, and circular design into our supply chain. for employees to learn more about what Google is doing We believe these principles can play a key role in reducing to empower people to make more sustainable choices, environmental impact and protecting human rights and suppo爀琀 our pa爀琀ners and customers, and operate our community health. Googlers chat among indoor plants at our Pier 57 o昀케ce in New York City. 78
Introduction Empowering individuals Working together Operating sustainably Governance and engagement Appendix 2023 Environmental Repo爀琀 in Brussels, which brought together policymakers, industry, and civil society to discuss how to accelerate climate Policy Public policy and advocacy action. He said, “At Google, we share the EU’s commitment engagement to action, and want to be a helpful pa爀琀ner in that progress.” In the Asia-Paci昀椀c region, we provided a public submission We know that strong public policy action is critical to Agreement, because climate scientists are clear: we have and statement of suppo爀琀 for Australia’s Climate Change Engagement on sustainability policy has been a top creating prosperous, equitable, and resilient low-carbon until 2030 to cha爀琀 a sustainable course for our planet, or Bill 2022 to enable the country to meet its Paris Agreement priority at Google for many years. Most recently, we economies around the world. we’ll face the worst consequences of climate change. 144 goals and reach net-zero emissions by 2050. were an o昀케cial pa爀琀ner at COP-27 in 2022, where we pa爀琀icipated in over 50 events and moments throughout The United Nations Framework Convention on Climate In 2022, we saw major steps forward on climate policy in We’ve led signi昀椀cant public policy engagement to suppo爀琀 the conference with public sector leaders from the United Change (UNFCCC)’s 2015 Paris Agreement states that the United States, Europe, and other regions. New policy strong sustainability outcomes. For instance, in the United States, Europe, Africa, the Middle East, and Asia to call for humanity must “keep global temperature rise this century measures and corporate commitments will continue to play States last year, we provided comments to the SEC’s ampli昀椀ed ambition on climate and to showcase the role 143 well below 2°C above pre-industrial levels.” Google an impo爀琀ant role in driving emissions reductions in the next proposed rule on enhanced climate-related disclosures. that the technology sector can play in enabling climate remains unwavering in our commitment to the Paris decade. See Figure 26 for our position on climate policy. In Europe, we shared input with the European Commission mitigation and adaptation. to suppo爀琀 policy measures to make sma爀琀phones and tablets, along with other devices, more repairable and FIGURE 26 We’ve consistently suppo爀琀ed strong climate policies sustainable. We also advocated for measures in the EU around the world in our public policy engagement and Our position on climate policy Renewable Energy Directive to suppo爀琀 24/7 carbon-free advocacy. In 2020, we published a climate change public energy supply models that enable companies to source policy position statement, Realizing a carbon-free future: clean energy for their operations. Google’s Third Decade of Climate Action, expressing At Google, we suppo爀琀 public policies that: our suppo爀琀 for public policies that strengthen global See Figure 27 for a detailed list of our sustainability policy climate action e昀昀o爀琀s through the Paris Agreement, • Strengthen global climate action e昀昀o爀琀s through the Paris Agreement, G20, and other multilateral engagements in 2022. establish emissions reduction targets and technology- forums to enhance international cooperation on climate. neutral pathways to achieve a carbon-free economy, • Establish emissions reduction targets and technology-neutral pathways to achieve a low-carbon and accelerate the development and deployment of 145 economy in line with the IPCC’s guidance and scienti昀椀c consensus. next generation low-carbon technology, among other • Use competitive, interconnected energy markets to empower consumers and speed up the transition provisions. In the United States, our federal lobbying to a clean economy. repo爀琀 covering Q4 2022 includes our lobbying e昀昀o爀琀s • Accelerate the development and deployment of next generation low-carbon technology, including with regard to U.S. federal climate and energy policy, harnessing digital technologies like AI and machine learning to suppo爀琀 climate action across businesses, including the Clean Energy for America Act, the CLEAN cities, governments, and civil society. Future Act, the Infrastructure Investment and Jobs Act, • Foster pa爀琀nerships and deepen collaboration across public and private actors to enable progress on and the energy provisions of the In昀氀ation Reduction Act, climate mitigation and adaptation by harnessing the full potential of climate solutions. all of which align with our advocacy for ambitious federal • Empower everyone to pa爀琀icipate in the transition to a sustainable economy and ensure that the clean climate and clean energy policies. energy economy provides economic growth for all—spurring a new generation of green jobs, bene昀椀ting the communities most impacted by a changing climate, and leaving no one behind in the transition. In Europe, our CEO Sundar Pichai shared vi爀琀ual remarks at A green wall at our inaugural Google European our inaugural Google European Sustainability Summit Sustainability Summit in Brussels. 79
Introduction Empowering individuals Working together Operating sustainably Governance and engagement Appendix 2023 Environmental Repo爀琀 FIGURE 27 Google’s policy engagements in 2022 U.S. SEC comments In pa爀琀nership with nine other peer technology companies, Google provided comments to Global and cross-cu琀琀ing initiatives on proposed rule on the Securities and Exchange Commission’s (SEC) proposed rule on enhanced climate-related Enhancement and disclosures. The comments state our suppo爀琀 for regular and consistent repo爀琀ing of climate- Google launched a policy roadmap for 24/7 CFE, laying out a vision for policies that we believe Standardization of related ma琀琀ers; note that investors need consistent, comparable, and reliable information on are critical to accelerating electricity grid decarbonization, informed by our experience as a Climate-Related the material risks and impacts of climate-related events and transition activities on a registrant’s Policy Roadmap for large energy consumer and clean energy purchaser in many di昀昀erent markets around the world. Disclosures for consolidated 昀椀nancial position; and provide guiding principles and recommendations for the SEC 24/7 Energy Policy The paper puts forward a detailed policy agenda with three key pillars: 1) rapidly developing and Investors to consider as it designs a 昀椀nal rule. deploying clean energy technologies, 2) expanding and reforming markets to value carbon-free energy and drive innovation, and 3) empowering energy consumers. U.S. Federal Google 昀椀led comments (initial and reply) in Improvements to Generator Interconnection Energy Regulatory Procedures and Agreements (interconnection) Notice of Proposed Rulemaking. Our comments Google was a 昀椀nancial sponsor of the 2022 Conference of the Pa爀琀ies of the UNFCCC, Commission emphasize the impo爀琀ance of reforms that allow independent power producers to continue in pa爀琀nership with the Egyptian government and the United Nations, and sent a delegation led comments on to thrive and deploy new clean energy resources to meet customer demand. In pa爀琀icular, we by Chief Sustainability O昀케cer Kate Brandt and VP of Engineering & Research Yossi Matias, along improving generator advocate for greater transparency in non-RTO (Regional Transmission Organization) regions Google at COP-27 with a number of senior subject ma琀琀er expe爀琀s. Googlers pa爀琀icipated in over 50 events and interconnection and penalties for delays to interconnection studies. UNFCCC Conference moments throughout the conference with public sector leaders from the United States, Europe, Africa, the Middle East, and Asia to call for ampli昀椀ed ambition on climate, and to showcase the Google 昀椀led comments on the Clean Hydrogen Production Standard dra昀琀 guidance. In U.S. Depa爀琀ment of role that the technology sector can play in enabling climate mitigation and adaptation. Energy comments pa爀琀icular, we highlighted the need for strong quality criteria—hourly temporal correlation, on Clean Hydrogen geographic correlation, and additionality—to ensure that grid-based clean hydrogen is produced using clean electricity. Production Standard United States Engagement with coalitions and sustainability initiatives Engagement on U.S. federal sustainability, climate, and energy policy Google.org provided a philanthropic grant to suppo爀琀 the establishment of the Secretariat of Suppo爀琀ing the U.S. As detailed in Google’s lobbying disclosure 昀椀lings, we conducted lobbying e昀昀o爀琀s regarding the U.S. State Depa爀琀ment’s Clean Energy Demand Initiative within the Clean Energy Buyers State Depa爀琀ment’s U.S. federal sustainability, climate, and energy policy, including on the Clean Energy for Clean Energy Demand Association. CEDI is an initiative led by the U.S. government that aims to connect countries with America Act, the CLEAN Future Act, the Infrastructure Investment and Jobs Act, the Clean companies seeking to rapidly deploy clean energy, enabling companies to send demand signals Legislative branch Electricity Pe爀昀ormance Program provisions of the Build Back Be琀琀er Act, the wholesale market Initiative (CEDI) for clean energy and advance policy measures that enable corporate clean energy procurement. engagement expansion and reform provisions of the Energy and Water Development and Related Agencies Together with business pa爀琀ners, Google helped launch three trade groups and campaigns Appropriations Act 2022, and the energy provisions of the In昀氀ation Reduction Act (IRA), all of to suppo爀琀 the creation of customer-centric wholesale electricity markets across the which align with our advocacy for ambitious federal climate and clean energy policies. Google Electricity customer United States, with the goal of enabling rapid decarbonization of electricity grids while executives expressed suppo爀琀 for the clean energy and climate provisions in the IRA. coalitions reducing costs. These include Western Freedom, Coalition for Energy Market Reform, and Electricity Customers Alliance. Google had multiple engagements with sta昀昀 and leadership in the U.S. Environmental Protection Agency (EPA), including 3 Google hosted events with EPA Administrator Michael U.S. state engagement Regan on environmental justice, how Google products promote recycling within the circular Executive branch economy, and using AI to identify lead pipes. At the U.S. Depa爀琀ment of Energy, Nest continued Utility regulation Google intervened in over 30 regulatory dockets across the United States with coalition engagement dialog with both the Loans Program O昀케ce about designation as an innovative product, and pa爀琀ners to promote the cost-e昀昀ective adoption of clean energy resources. O昀케ce of the Under Secretary for Science and Innovation. We also met with the White House Regulatory Google led discussions with the National Association of Regulatory Utility Commissioners and on multiple projects, and received invitations to summits for our work on lead pipe reduction frameworks for the National Association of State Energy O昀케cials to discuss how Google’s 24/7 CFE goal can be and home electri昀椀cation. decarbonization a suppo爀琀ive framework to drive cost-e昀昀ective grid decarbonization. 80
Introduction Empowering individuals Working together Operating sustainably Governance and engagement Appendix 2023 Environmental Repo爀琀 Europe Asia-Paci昀椀c Engagement on European sustainability, climate, and energy policy Asia Clean Energy As a founding member, Google helped launch ACEC at COP-27 to work together with other companies and organizations to accelerate corporate clean energy sourcing and help Coalition (ACEC) Google engaged with EU policy makers through Digital Europe to inform the development of decarbonize electrical grids in the region. Energy E昀케ciency Directive a standardized energy and sustainability repo爀琀ing framework for data centers, and establish Google suppo爀琀ed an APEC Energy Working Group project, sponsored by the U.S. Depa爀琀ment measures to encourage greater reuse of waste heat. of Energy and the Paci昀椀c No爀琀hwest National Laboratory. The project led to a repo爀琀 that Asia-Paci昀椀c Economic Google worked through Digital Europe and RE-Source to advocate for the inclusion of time- summarized key insights and recommendations shared during two workshops, highlighting Cooperation (APEC) stamping for Guarantees of Origin in the EU Renewable Energy Directive, enabling hourly Renewable Energy ways governments and the private sector can lead and pa爀琀ner to accelerate power system carbon-free energy matching and greater transparency of clean energy claims. Google also Directive decarbonization across the region. organized an industry le琀琀er encouraging the European Commission to issue strong rules that Australia - maintain the environmental integrity of grid-based hydrogen production. Clean Energy Google signed onto an MOU between Australia Climate Change and Energy Minister Chris Circular economy Demand Initiative Bowen and U.S. Special Presidential Envoy for Climate John Kerry, focused on breaking down ecodesign regulations Google responded to public consultation in September 2022, providing technical feedback on Memorandum of barriers to enable corporate clean energy procurement in Australia. Understanding on sma爀琀phones and the EU ecodesign regulations on sma爀琀phones and tablets. tablets Google pa爀琀nered with the Australian Government’s national science and research agency, the Australia - AI Commonwealth Scienti昀椀c and Industrial Research Organisation, and the Depa爀琀ment of Foreign Sustainable Google submi琀琀ed comments to the European Commission’s public consultation regarding and blue carbon A昀昀airs and Trade on a project to explore novel applications of AI to measure, with greater consumption of the promotion of repair and reuse of goods. We shared our views on the core principles to collaboration e昀케ciency and accuracy, the capacity of seagrass ecosystems to absorb and sequester carbon public goods (e.g., consider when introducing policy measures to promote repair and reuse horizontally, and for in the Indo-Paci昀椀c. “right to repair”) sma爀琀phones and tablets speci昀椀cally. Google provided a public submission and statement of suppo爀琀 on the Climate Change Bill 2022 and the Climate Change (Consequential Amendments) Bill 2022, which passed the Australian Body of European Google responded to a questionnaire by BEREC in view of the development of key pe爀昀ormance Regulators indicators to characterize the environmental impact of electronic communications, networks, Australia - Climate Parliament on September 8th, 2022. The former outlines Australia’s GHG emissions reduction Change Bill targets of 43% reduction from 2005 levels by 2030, and net zero by 2050. The la琀琀er makes for Electronic devices, and services. We provided information about our environmental repo爀琀ing practices Communications and suggestions to help identify which indicators would provide relevant environmental consequential amendments to incorporate Australia’s GHG emissions reduction targets under the Paris Agreement into legislation for relevant Commonwealth entities and schemes. (BEREC) information. Engagement with coalitions and sustainability initiatives Google is a strategic pa爀琀ner and steering commi琀琀ee member of the RE-Source Pla琀昀orm, the European pla琀昀orm for corporate renewable energy sourcing. Through its policy advocacy RE-Source Pla琀昀orm and resources for renewable energy buyers, RE-Source seeks to remove barriers to corporate purchasing of renewable energy in suppo爀琀 of Europe’s climate and energy goals. 81
Introduction Empowering individuals Working together Operating sustainably Governance and engagement Appendix 2023 Environmental Repo爀琀 Trade associations and We’re also members of the U.S. Chamber of Commerce, its events or advocacy positions, nor the views of its 1.5°C and create a prosperous and competitive Business Roundtable, and other business trade leaders or members. We assess the alignment of our zero-carbon economy. We’re in dialogue with our trade associations, where we’re engaged in climate and energy trade association pa爀琀icipation with the goals of the Paris associations to encourage alignment between our third-pa爀琀y groups policy issues. For example, we’re founding members Agreement, and engage within organizations to suppo爀琀 core public policy objectives and their policy advocacy of the Chamber’s Task Force on Climate Actions, and advocacy for climate policies needed to limit warming to activities, including on climate change. We belong to many sustainability-focused third-pa爀琀y we’ve engaged within the Task Force since its inception groups through which we engage on sustainability policy to suppo爀琀 constructive engagement by the Chamber issues around the world—for example, organizations like on climate policy to create a zero-carbon economy. We the American Clean Power Association, the European also pa爀琀icipate in sta昀昀-level discussions on the Business Climate Neutral Data Center Pact, RE100, the Asia Clean Roundtable’s Energy and Environment commi琀琀ee. Energy Coalition, and many more. In addition, we’ve helped to found organizations such as the Clean Energy We respect the independence and agency of trade Buyers Association and the United Nations 24/7 Carbon- associations and third pa爀琀ies to shape their own policy Free Energy Compact. See Figure 28 for more details. agendas, events, and advocacy positions. Our sponsorship or collaboration with a third-pa爀琀y organization doesn’t mean that we endorse the organization’s entire agenda, FIGURE 28 Google’s sustainability-focused trade associations and memberships • Advanced Energy United • Digital Europe • Advanced Energy Buyers Group • Energy Alabama • Advanced Power Alliance • Energy Tag • Alliance to Save Energy • Glasgow is Our Business • American Clean Power Association • Japan Climate Leaders Pa爀琀nership • American Council on Renewable Energy • Markto昀昀ensive Erneuerbare Energien • Americans for a Clean Energy Grid • No爀琀h Carolina Sustainable Energy Association • Asia Clean Energy Coalition • RE100 • Business Alliance to Scale Climate Solutions • RE-Source • Carolinas Clean Energy Business Association • Resources for the Future • Business Environment Leadership Council of • Renewable No爀琀hwest the Center for Climate and Energy Solutions • Sma爀琀 Electric Power Alliance • Clean Energy Buyers Association • SolarPower Europe • Clean Energy Demand Initiative • We Are Still In • Clean Grid Alliance • WindEurope • Conservation Voters of South Carolina With our Bay View campus, we paid careful a琀琀ention to the characteristics of the spaces you can see and feel, like materials and daylight, but also to aspects that are harder to see, like air quality, thermal comfo爀琀, and acoustics. 82
Introduction Empowering individuals Working together Operating sustainably Governance and engagement Appendix 2023 Environmental Repo爀琀 Organization Details Pa爀琀nerships Exponential Roadmap In 2021, we joined the Exponential Roadmap Initiative and the U.N. Race to Zero Campaign, the largest ever Initiative alliance commi琀琀ed to halving emissions before 2030 towards net-zero emissions by no later than 2050. Google pa爀琀ners with many organizations to accelerate progress towards shared sustainability goals. Examples of some key pa爀琀nerships are in Figure 29. At the World Economic Forum Annual Meeting in 2022, Google joined the First Movers Coalition. As a champion for the Carbon Dioxide Removal sector, Google commi琀琀ed to contract for durable and scalable net carbon First Movers Coalition FIGURE 29 dioxide removal to be achieved by the end of 2030. Organization Details In 2022, we commi琀琀ed $200 million to Frontier, an advanced market commitment that will accelerate the development of carbon removal technologies by guaranteeing future demand. We were one of 昀椀ve companies Frontier that made a $925 million total pledge to Frontier. As one of its founding members, we’re helping to guide overall In 2021, we helped launch the 24/7 Carbon-Free Energy Compact in pa爀琀nership with Sustainable Energy for All 24/7 Carbon-Free strategy and governance. and UN-Energy to help grow the movement to enable zero-carbon electricity. In 2022, the compact surpassed Energy Compact 100 signatories. Google’s Environmental Insights Explorer was developed in pa爀琀nership with GCoM through a shared vision to Global Covenant of Google has pa爀琀nered closely with BEF since 2019 to kick o昀昀 the implementation of our water strategy. In suppo爀琀 Bonneville Mayors for Climate suppo爀琀 city climate action with useful and accessible data and insights. Today, GCoM is a strategic pa爀琀ner, of our 2030 replenishment and watershed health goals, it helped us to identify and suppo爀琀 impac琀昀ul water Environmental sharing EIE data with its alliance of cities and local governments to accelerate climate action. & Energy (GCoM) replenishment and watershed health projects globally, with a variety of local organizations and pa爀琀ners. Foundation (BEF) Google is a pa爀琀ner of the regional secretariats of ICLEI—Local Governments for Sustainability—in Africa, Europe, Business for Social Google has been a member of BSR for many years and is one of a few select Spark members. We pa爀琀icipate in and the U.S. Through these pa爀琀nerships, ICLEI regional teams suppo爀琀 sustainable city development projects ICLEI Africa Responsibility (BSR) a number of BSR collaboration initiatives, and one of our senior leaders sits on its board. with data and insights from Google’s Environmental Insights Explorer. Additionally, in 2022, Google.org provided ICLEI Europe C40 and Google launched the 24/7 Carbon-Free Energy for Cities program to empower cities around the world a $10 million grant to ICLEI to suppo爀琀 10 nonpro昀椀t-led projects in the United States and Europe that help cities ICLEI USA to run entirely on clean energy, and the program will soon be expanded into Africa with grant suppo爀琀 from accelerate their sustainable transition through data-driven environmental and climate action at the local level. Google.org. C40 is a strategic pa爀琀ner of Google’s Environmental Insights Explorer, using its environmental data C40 Cities and insights to help suppo爀琀 its network of nearly 100 world-leading cities collaborating to deliver urgent action iMasons Climate Google is a founding member and pa爀琀 of the governing body of the iMasons Climate Accord, a coalition united to confront the climate crisis. Accord on carbon reduction in digital infrastructure. In 2018, 21 companies joined Google in launching the Coalition to End Wildlife Tra昀케cking Online, collectively Coalition to End creating a wildlife policy framework for online trade and an industry-wide approach to reduce online wildlife In 2022, to activate industry-wide change, Google provided anchor funding to kicksta爀琀 the ReFED Catalytic Wildlife Tra昀케cking ReFED tra昀케cking. The coalition unites the tech industry to standardize prohibited wildlife policies, be琀琀er detect illicit Grant Fund, with the goal of accelerating and scaling food waste solutions. Online wildlife products, enhance automated detection 昀椀lters, and empower users to repo爀琀 suspicious listings. In 2022, Google suppo爀琀ed three of the Nature Conservancy’s watershed projects in Chile and the United In addition to repo爀琀ing our carbon footprint to CDP since 2009, we’ve pa爀琀nered with CDP to host its annual CDP (formerly States, and Google.org suppo爀琀ed a three-phased approach to catalyze active reforestation of kelp at impac琀昀ul conference, a hack-a-thon, and to launch CDP scores in Google Finance, making corporate carbon disclosure known as the Carbon The Nature scales. Google.org also provided a grant to TNC to develop a machine-learning-powered timber-tracing API to information more widely available. Disclosure Project) Conservancy (TNC) stop deforestation in the Amazon at scale; a team of Google engineers is working full-time for six months with Google was actively involved in the creation of CEBA in 2018, chairing the Interim Board of Directors during its TNC to develop this product as pa爀琀 of the Google.org Fellowship Program. transition from an NGO-led e昀昀o爀琀 into a corporate-led trade association. A Google representative continues to Clean Energy Buyers serve as the Board Chair of this organization. Google provided initial 昀椀nancial suppo爀琀 for the development of the Association (CEBA) Since 2015, Google and the U.N. Food and Agricultural Organization have pa爀琀nered on the monitoring of organization and in 2022, Google.org provided a $1 million grant to suppo爀琀 CEBA’s international expansion. United Nations Food forests, natural resources, livelihoods, and the environment. FAO uses Google Ea爀琀h Engine for satellite remote and Agriculture Climate Neutral Data Google helped establish the Climate Neutral Data Centre Pact, a coalition of European data center operators who sensing and geospatial data science towards groundbreaking science and operational work昀氀ows used by Organization (FAO) Centre Pact (CNDCP) commit to a set of voluntary sustainability targets to set them on a path toward climate neutrality. practitioners around the globe. Google is a pa爀琀ner of the Ellen MacA爀琀hur Foundation, having joined the foundation’s network in 2015, and has co- Ellen MacA爀琀hur authored a number of thought leadership white papers and case studies in areas such as safer chemistry, United Nations In collaboration with UNEP and the European Commission Joint Research Centre, Google launched a new Foundation (EMF) the deconstruction and reuse of commercial o昀케ce buildings, electronics, and AI. Environment Program pla琀昀orm—the Freshwater Ecosystems Explorer—enabling all countries to freely measure and monitor freshwater (UNEP) resources (towards Sustainable Development Goal 6.6.1), and when and where su爀昀ace water is changing. Environmental Google has pa爀琀nered with EDF to map air quality using Street View cars in the U.S., Europe, and Southeast Asia, Defense Fund (EDF) and to detect methane leaks in cities since 2011. World Business Google suppo爀琀ed the launch of the European 24/7 Hub with Eurelectric, which provides education on the Google has been a member of the WBCSD for several years and pa爀琀icipates in a number of its initiatives. Council for “what, why, and how” of 24/7 carbon-free energy buyers and suppliers in Europe. Google spoke at the European 24/7 Hub We’re actively involved in initiatives related to improving well-being for people and the planet, including Sustainable launch event during European Sustainable Energy Week. shi昀琀ing diets, consumer behavior changes, and regenerative agriculture. Development European Climate Google was among the leading businesses that joined the European Climate Pact in its inaugural year to share our (WBCSD) Pact commitment to help achieve a climate neutral Europe. Google is an active member of the EGDC—a group of technology companies commi琀琀ed to suppo爀琀ing the Google has a 13-year long relationship with WRI for impact-focused collaboration. Some key projects include developing a near-real-time land cover dataset (Dynamic World), deforestation monitoring and ale爀琀s (Global World Resources European Green green and digital transformation of the EU. As a member, Google pa爀琀icipates in the initiative, designed to Forest Watch), ending commodity-driven deforestation and accelerating restoration (Forest Data Pa爀琀nership), Institute (WRI) Digital Coalition harness the emission-reducing potential of digital solutions for all other sectors, and suppo爀琀 green and digital measuring and mitigating extreme heat (suppo爀琀ed by Google.org), and educating stakeholders on 24/7 CFE. (EGDC) transformations in the EU. 83
Introduction Empowering individuals Working together Operating sustainably Governance and engagement Appendix 2023 Environmental Repo爀琀 Awards and recognition 2022 CDP Climate Change A List 2022 CDP Supplier Engagement Leader EPA Green Power Leadership Award (2022) Alphabet has been named to CDP’s Climate Change A list, Alphabet achieved an A-rating, making it onto CDP’s Supplier Google was recognized by the EPA for its exemplary use of demonstrating our continued commitment to transparency and Engagement Rating Leaderboard. green power and commitment to innovation and market guidance climate repo爀琀ing. Since 2014, Alphabet has been included on through leadership in the green power markets. CDP’s Climate Change A List eight times. ENERGY STAR Excellence Award 2021 FSC Leadership Award RE100 Changemaker Award (2021) in Product Design (2022) Google earned a 2021 leadership award from the Forest Stewardship Google won RE100’s Changemaker Award for our innovative 24/7 Council (FSC), which recognizes excellence that advances clean power strategy. In 2022, Google Nest won an ENERGY STAR Excellence Award in responsible forest management and conservation, for our e昀昀o爀琀s Product Design for the product’s best-in-class sma爀琀 technology, to incorporate FSC-ce爀琀i昀椀ed timber at our Bay View and Charleston enabling increased energy e昀케ciency. East o昀케ce campuses. Center for Resource Solution Green Power 2022 Carbon Clean200 2022 Corporate Knights’ 100 Most Leadership Award Winner (2021) Sustainable Companies Alphabet achieved a #2 ranking on the 2022 Carbon Clean200 list. Together, Google and M-RETS won a Green Power Leadership Award Alphabet was ranked #37 out of the world’s 100 most for Market Development for piloting their concept of time-based sustainable corporations. energy a琀琀ribute ce爀琀i昀椀cates at Google data centers. 84
Introduction Empowering individuals Working together Operating sustainably Governance and engagement Appendix 2023 Environmental Repo爀琀 Repo爀琀ing approach and methodology Repo爀琀 scope Data measurement and unce爀琀ainty Assurance Appendix Methodology Forward-looking information Environmental data tables Environmental repo爀琀ing frameworks index Endnotes Glossary 85
Introduction Empowering individuals Working together Operating sustainably Governance and engagement Appendix 2023 Environmental Repo爀琀 introduce and implement operational policies over an Methodology asset, and we repo爀琀 all energy and emissions for Alphabet Repo爀琀ing approach and Inc. and its subsidiaries’ data centers, o昀케ces, and other assets under our operational control (“Global Facilities”). methodology The below methodologies apply to our GHG emissions, In September 2022, Google acquired Mandiant, and as well as ce爀琀ain other carbon, energy, and water metrics Mandiant’s emissions are included in our organizational as presented in our Environmental data tables, focused boundary for 昀椀scal year 2022. primarily on those where we have obtained third-pa爀琀y limited assurance. These metrics have been rounded as As we improve our methodologies and as new information Our Scope 1 and Scope 2 emissions include four of the described below. Due to rounding applied to all repo爀琀ed becomes available, we may continue to revise our estimates Repo爀琀 scope seven GHGs addressed by the Kyoto Protocol—carbon years of data in our 2023 Environmental Repo爀琀, some of and assumptions. Methodology changes may include dioxide (CO ), methane (CH ), nitrous oxide (N O), and our repo爀琀ed values for prior years don’t directly match 2 4 2 changes in a calculation, improvements in the quality of This repo爀琀 includes data covering our 昀椀scal year hydro昀氀uorocarbons (HFCs). Other GHGs, including the related Independent Accountants’ Review Repo爀琀s data, new activity types for greater data granularity, and January 1, 2022 through December 31, 2022. Most of pe爀昀luorocarbons (PFCs), sulfur hexa昀氀uoride (SF ), and from those years. 6 updates to available supplier-repo爀琀ed data. Such updates our environmental data covers Alphabet Inc. and its nitrogen tri昀氀uoride (NF ), aren’t included in our inventory, 3 may result in material changes to our calculations and may subsidiaries, the largest of which is Google. All repo爀琀ed as they’re not emi琀琀ed as a result of our operations. also result in adjustments made to the current and previous data is global and annual unless otherwise speci昀椀ed. Greenhouse gas Fu爀琀her, in 2022, CO alone represented over 98% of our 2 periods, including our base year. Where material, we’ve total Scope 1 and Scope 2 market-based emissions. We disclosed these changes and whether previous periods emissions conve爀琀 all emissions to metric tons of carbon dioxide Data have been adjusted to re昀氀ect these updates. equivalent (tCO e) for repo爀琀ing. All repo爀琀ed values are 2 rounded to the nearest hundred, unless otherwise noted. measurement GHG emissions repo爀琀ing Assurance standards We source the global warming potentials (GWP) for each and unce爀琀ainty GHG from the IPCC Fou爀琀h Assessment Repo爀琀, Appendix GHG emissions are calculated according to the We obtain limited third-pa爀琀y assurance from an A: Global Warming Potentials. Greenhouse Gas Protocol standards and guidance independent auditor for ce爀琀ain environmental data, All repo爀琀ed values represent the best data available at time developed by the WRI and the WBCSD, including A including select GHG emissions, energy, and water of publication. Where actual data isn’t available, we may use Scope 1 GHG emissions metrics as indicated in our Environmental data tables Corporate Accounting and Repo爀琀ing Standard (Revised estimates. We base our estimates and methodologies on Edition), Scope 2 Guidance, and Technical Guidance below. Ernst & Young LLP reviewed these metrics for the historical experience, available information, and on various Scope 1 GHG emissions are direct emissions from sources for Calculating Scope 3 Emissions (collectively, “the 昀椀scal year ended December 31, 2022. For more details, other assumptions that we believe to be reasonable. such as company vehicles or generators at our o昀케ces Greenhouse Gas Protocol”). see our 2022 Independent Accountants’ Review Repo爀琀. and data centers. They represent direct emissions from All environmental data found in this repo爀琀 is subject to owned Global Facilities, including fuel use from back-up Prior to 昀椀scal year 2019, another third pa爀琀y veri昀椀ed the measurement unce爀琀ainties resulting from limitations generators, fuel consumption from our operated vehicles Our inventory following emissions: Scope 1, Scope 2 (market-based), inherent in the nature and the methods used for and aircra昀琀, methane and nitrous oxide from biogenic Scope 2 (location-based), Scope 3 (business travel determining such data. The selection of di昀昀erent but fuel sources, natural gas usage, and refrigerant leakage. We use the operational control approach to de昀椀ne our and employee commuting), and biogenic. For more acceptable measurement techniques can result in Where actual data isn’t available, estimated natural gas organizational boundary, which means that we account for information, see our prior annual Environmental Repo爀琀s. materially di昀昀erent measurements. The precision of consumption is calculated using square footage of Global all emissions from operations over which we have control. di昀昀erent measurement techniques may also vary. Facilities and internally-developed natural gas intensity We de昀椀ne operational control as having the authority to 86
Introduction Empowering individuals Working together Operating sustainably Governance and engagement Appendix 2023 Environmental Repo爀琀 factors by o昀케ce type, based on data from the current isn’t available, estimated electricity and natural gas Scope 3 GHG emissions factors from WRI and annual Bay Area procurement 昀椀scal year. consumption is calculated using square footage of Global volumes to estimate emissions, which we extrapolate to Facilities and internally developed electricity and natural our global operations using building admi琀琀ances. Scope 3 GHG emissions are indirect emissions from Beginning in 2022, in an e昀昀o爀琀 to continuously implement gas intensity factors by o昀케ce type, based on data from other sources in our value chain, such as our suppliers, best practice methodologies, we included fugitive the current 昀椀scal year. In our Environmental data tables, emissions from use of our consumer hardware products, and business emissions from refrigerant leakage in our operational manufacturing consumer hardware products are travel. We estimate our Scope 3 GHG emissions using boundary. These emissions represented approximately Beginning in 2022, emissions from estimated refrigerant presented in Category 2: “Capital goods.” Emissions from the the Greenhouse Gas Protocol’s Technical Guidance 17% of our 2022 Scope 1 GHG emissions. Where actual leakage were calculated using an internally-developed our food program are presented in “Other categories.” for Calculating Scope 3 Emissions (version 1.0), in the refrigerant leakage data isn’t available, we estimate global warming potential and leakage rate. Refrigerant following categories identi昀椀ed as relevant: refrigerant leakage using an internally-developed leakage included in Scope 2 GHG emissions is immaterial. Category 2: “Capital goods” includes upstream global warming potential and a leakage rate. We didn’t We didn’t recalculate prior year Scope 2 GHG emissions to • Category 1: Purchased goods and services emissions from the production of capital goods recalculate our Scope 1 GHG emissions for prior years to include refrigerant leakage. • Category 2: Capital goods we’ve purchased, including computing and storage include refrigerant leakage. • Category 4: Upstream transpo爀琀ation and distribution hardware used in our data centers. This category also The emission factors used to calculate Scope 2 (location- • Category 6: Business travel includes emissions from data center construction. For The emission factors used to calculate Scope 1 emissions based) emissions include the 2017 WRI/WBCSD GHG • Category 7: Employee commuting, including manufacturing of capital goods, we collect supplier include the 2017 WRI/WBCSD GHG Protocol Emission Protocol Emission Factors from Cross Sector Tools, Scope 1 and 2 GHG emissions data directly from our teleworking Factors from Cross Sector Tools, the 2023 EPA Center the 2022 IEA Emission Factors, the 2023 EPA eGRID • Category 11: Use of sold products hardware contract manufacturers, component suppliers, for Corporate Climate Leadership GHG Emission Emission Factors, and the 2022 Climate Registry Default • Category 12: End-of-life treatment of sold products and fabless suppliers through the CDP Supply Chain Factors Hub, and the 2022 Depa爀琀ment for Environment, Emission Factors. Program; these suppliers represent our key “Tier 1” Food and Rural A昀昀airs (DEFRA) U.K. Government GHG hardware manufacturing suppliers with whom we have In our Environmental data tables, we present ce爀琀ain Conversion Factors. The emission factors used to calculate Scope 2 (market- a direct relationship. Where supplier emissions data emissions from Category 1, Category 2, Category 11, based) emissions include the 2017 WRI/WBCSD GHG isn’t available, we estimate with industry-average GHG nd Category 12 as an aggregated subtotal—“Other Scope 2 GHG emissions Protocol Emission Factors from Cross Sector Tools, the intensities by commodity type and spend data. Data categories”—for business reasons, as described fu爀琀her 2022 IEA Emission Factors, the 2022 Association for center construction emissions are estimated by using an below. Issuing Bodies European Residual Mixes, the 2023 EPA LCA analysis to derive construction emissions data and Scope 2 GHG emissions are indirect emissions from eGRID Emission Factors, the 2022 Climate Registry Default then applying this to our construction activity. purchased electricity, the production of space heating for Our Operational Scope 3 emissions are made up of Emission Factors, and emission factors speci昀椀c to energy our leased o昀케ces, and refrigerant leakage at our leased Category 6 and Category 7, and are third-pa爀琀y assured. a琀琀ribute ce爀琀i昀椀cates. The adjusted emission factors from In our Environmental data tables, emissions from our o昀케ces. The location-based method re昀氀ects the average All repo爀琀ed Scope 3 emissions values are rounded to the the Association for Issuing Bodies European Residual Tier 1 hardware manufacturing suppliers are presented in carbon intensity of the electric grids where our operations nearest thousand. Mixes are used for European facilities. Outside of Europe, Category 2: “Capital goods,” and emissions beyond our are located and thus where our electricity consumption adjusted emission factors aren’t available to account for Tier 1 hardware manufacturing suppliers are presented in occurs. The market-based method incorporates our Category 1: “Purchased goods and services” includes “Other categories.” Data center construction emissions voluntary purchases. procurement choices, namely our renewable energy emissions generated from manufacturing consumer are presented in “Other categories.” purchases via contractual mechanisms like power hardware and our food program. To estimate full supply purchase agreements (PPAs). chain emissions generated from manufacturing consumer Category 4: “Upstream transpo爀琀ation and hardware, we pe爀昀orm third-pa爀琀y-veri昀椀ed Life Cycle distribution” includes emissions generated primarily Actual data, such as third-pa爀琀y invoices, is used Assessments (LCAs) in accordance with ISO 14040 and from transpo爀琀ation and warehousing of our consumer to calculate Scope 2 emissions. Where actual data 14044. For our food program, we use LCA emission 87
Introduction Empowering individuals Working together Operating sustainably Governance and engagement Appendix 2023 Environmental Repo爀琀 products and data center equipment. We collect worksites by private vehicle, public transit, motorcycle, Category 12: “End-of-life treatment of sold products” Emissions reductions and consumer products and data center equipment and gas-powered scooter commuting trips. To determine includes GHG emissions associated with the end-of-life compensations transpo爀琀ation emissions from our logistics providers. the number of commuting trips by mode made in 2022, we treatment of all of Google’s 昀氀agship consumer hardware These well-to-wheel (WTW) GHG emissions are surveyed our employees to determine typical commuting products sold in 2022. End-of-life impact was calculated We calculate our total operational emissions by summing calculated based on fuel use or weight-distance data pa琀琀erns and applied these commuting pa琀琀erns to our through our LCA process using emission factors from Scope 1, Scope 2 (market-based), Scope 3 (Category and routing associated with a shipment. Where logistics global employee population. The calculation uses an the 2022 Sphera LCA for Expe爀琀s database. Our initial 6: Business travel), and Scope 3 (Category 7: Employee provider emissions data isn’t available, we use weight average commuting distance for passenger vehicles assessments identify this category to be one that doesn’t commuting, including teleworking), per the criteria and distance data by shipment collected from the obtained from the U.S. Depa爀琀ment of Transpo爀琀ation’s have signi昀椀cant life-cycle impact. We continue to develop described above. This market-based subtotal has been providers to estimate WTW emissions, using emissions 2017 National Household Travel Survey and an average fuel programs to extend the life of our sold products and also reduced by the impact of renewable energy procurement factors from the 2019 Global Logistics Emissions Council e昀케ciency for passenger vehicles obtained from the U.S. to ensure e昀케cient management of end-of-life materials. via PPAs and market-based emission factors. (GLEC) framework. Where logistics provider data isn’t Depa爀琀ment of Transpo爀琀ation’s Transpo爀琀ation Statistics In our Environmental data tables, emissions from end-of- available, emissions are estimated based on repo爀琀ed Table 4–23. Data obtained from our value chain pa爀琀ners life treatment of sold products are presented in “Other Our operational emissions are then fu爀琀her compensated data from other transpo爀琀ation providers and the number isn’t used at this time. Emissions are calculated using categories.” for by high-quality carbon credits enabled through of units shipped. For warehousing emissions, we collect 2022 DEFRA U.K. Government GHG Conversion Factors contracted carbon o昀昀set projects, which capture and energy data directly from the warehouses and estimate for passenger vehicles. This category also includes In 2022, we revised our methodology to calculate destroy highly potent GHGs. A carbon o昀昀set project is emissions using LCA electricity and fuel factors from teleworking emissions, which we began to estimate and emissions related to our consumer hardware an activity that reduces GHG emissions or captures GHG the 2022 Sphera LCA for Expe爀琀s database. Where repo爀琀 in 2020, when teleworking became prevalent due manufacturing, as we updated from a spend-based emissions from the atmosphere, ultimately represented warehouse energy data isn’t available, we estimate using to the global pandemic. Teleworking represents emissions methodology to a Life Cycle Assessment-based by a carbon credit. The carbon credit signi昀椀es that the 2018 Commercial Buildings Energy Consumption generated by employees working remotely from their methodology. We also made improvements to the quality GHG emissions are lower than if no one had invested Survey (CBECS) data and the warehouse square footage homes. We apply the estimation methodology outlined in of data used in estimating our emissions associated in the project. One carbon credit equals one metric ton allocated to Alphabet. EcoAct’s 2020 Homeworking Emissions white paper to our with manufacturing our data center hardware, as well of carbon dioxide equivalent prevented from entering annual average workforce in 2022. as the LCAs and LCA emission factors used to calculate Category 6: “Business travel” includes emissions from emissions related to data center construction. We didn’t the atmosphere. We assess these projects against four standards before investing: additionality, leakage air, rail, and car rental travel. Distance and fuel-based Category 11: “Use of sold products” includes emissions recalculate prior year Scope 3 GHG emissions to re昀氀ect prevention, permanence, and veri昀椀ability. travel data is collected through our online booking system generated by all of Google’s 昀氀agship consumer hardware these changes. or through a third-pa爀琀y travel agency for all sources. products sold in 2022. Flagship consumer hardware We primarily enter into long-term purchase agreements Data obtained from our value chain pa爀琀ners isn’t used at products are products that can provide their main Biogenic emissions with carbon credit suppliers to secure future deliveries. this time. Emissions are calculated using 2022 DEFRA U.K. functionality without connection to another product. For Once carbon credits from a project under contract Government GHG Conversion Factors for air travel, the example, this doesn’t include accessories, such as cases. In accordance with the Greenhouse Gas Protocol, are veri昀椀ed by a third-pa爀琀y and issued by a carbon 2017 WRI/WBCSD GHG Protocol Emission Factors from Use impact was calculated using laboratory power draw biogenic emissions are repo爀琀ed separately from registry, per the agreement terms, ownership of the Cross Sector Tools for rail travel, and the 2023 EPA Center measurements, data on use pa琀琀erns, common industry other Scope 1 GHG emissions. These CO emissions 2 carbon credits is transferred from the project owner to for Corporate Climate Leadership GHG Emission Factors assumptions on product lifetimes, and LCA electricity are generated from our operated vehicles consuming Google. Our carbon credits are veri昀椀ed under the Climate Hub for car rental travel. emission factors from the 2022 Sphera LCA for Expe爀琀s biofuels. Biogenic emissions are calculated using emission Action Reserve (CAR), American Carbon Registry (ACR), database. In our Environmental data tables, emissions factors from the 2023 EPA Center for Corporate Climate Category 7: “Employee commuting, including from use of sold products are presented in “Other Veri昀椀ed Carbon Standard (VCS), or the UNFCCC Clean Leadership GHG Emission Factors Hub. teleworking” includes emissions from the transpo爀琀 of categories.” Development Mechanism. our full-time employees between their homes and their 88
Introduction Empowering individuals Working together Operating sustainably Governance and engagement Appendix 2023 Environmental Repo爀琀 All carbon credits are retired on a public registry a昀琀er GRI Disclosure 302-1c(i) and 302-1f, and includes both Water metrics they’re delivered to us. Due to the timing of third-pa爀琀y purchased and self-generated electricity. Where actual Forward-looking veri昀椀cations, delivery and retirement for some 2022 electricity consumption for facilities isn’t available, we We repo爀琀 all water metrics for Alphabet Inc. and its carbon credits occurs a昀琀er the year ended December estimate consumption using company square footage and information subsidiaries’ data centers, o昀케ces, and other assets under 31, 2022. The Greenhouse Gas Protocol states that a internally developed electricity intensity factors based on our operational control. “Water consumption” is equal GHG target can be met through using credits that are 昀椀scal year 2022 data. References to information in this repo爀琀 should not be to (“Water withdrawal” – “Water discharge”). Our generated from GHG reduction projects at sources construed as a characterization regarding the materiality repo爀琀ed water consumption, water withdrawal, and water external to the (company’s) boundary. They’re designed Electricity purchased from renewable sources (%) is of such information to our 昀椀nancial results or our discharge metrics don’t include seawater. Water metrics to be interchangeable globally and deliverable from a calculated on a calendar-year basis, dividing the volume operations. While ce爀琀ain ma琀琀ers discussed in this repo爀琀 are rounded to the nearest hundred thousand gallons and variety of project types. Refer to our Google’s Carbon of renewable electricity (in megawa琀琀-hours) procured for may be signi昀椀cant, any signi昀椀cance should not be read are repo爀琀ed in million gallons. O昀昀sets: Collaboration and Due Diligence white paper our global operations (i.e., renewable energy procured as necessarily rising to the level of materiality used for for additional information. The quantity of carbon credits through our PPA contracts, on-site renewable energy the purposes of complying with applicable securities Water withdrawal data is based on actual metered enabled through contracted projects is subject to the generation, and renewable energy in the electric grids laws and regulations. The information in this repo爀琀 may or invoiced data when it’s available. At o昀케ces where limited assurance procedures noted above; however, the where our facilities are located) by the total volume of contain projections, future estimates, plans, expectations, metered or invoiced data isn’t available, water withdrawal quality of our projects and the related due diligence isn’t electricity consumed by our global operations. This metric goals, and other forward-looking statements. Forward- is estimated using facility square footage and internally subject to the limited assurance procedures. includes all renewable energy purchased, regardless of looking statements are based on current expectations developed water withdrawal intensity factors by o昀케ce the market in which the renewable energy was consumed. and assumptions that are subject to ce爀琀ain risks and type based on 昀椀scal year data. In all instances where unce爀琀ainties, which could cause our actual results to Other carbon and Google currently purchases enough renewable energy actual potable water discharge isn’t available, we apply a di昀昀er materially from those re昀氀ected in the forward- to match our annual global electricity consumption. 90% discharge 昀氀ow factor to the facility water withdrawal energy metrics looking statements. Any changes in methodology may To achieve our 100% renewable energy match goal, to estimate water discharge. For irrigation water, we apply result in material changes to our calculations and may a 0% discharge 昀氀ow factor to the facility water withdrawal we 昀椀rst consider both our on-site renewable energy Our carbon intensity metrics are calculated as de昀椀ned result in the current and previous periods, including our to estimate water discharge. This estimation process is generation and the renewable energy that’s already in the base year, to be adjusted. Except as required by law, we by GRI Disclosure 305-4a-c. Carbon intensity metrics are applicable to all o昀케ces and to potable and irrigation water electric grids where our facilities are located, then procure unde爀琀ake no obligation to correct, revise, or update any based on gross global combined Scope 1 and Scope 2 withdrawal at data centers used for domestic purposes renewable energy through PPA agreements and utility information included in this repo爀琀. (market-based) emissions. Repo爀琀ed carbon intensity per (i.e., water not used for IT cooling) where actual discharge renewable energy tari昀昀s. We have a few facilities located unit of revenue and per full-time equivalent (FTE) employee isn’t available. in geographies where we’re not currently able to source values are rounded to the nearest hundredth, and repo爀琀ed large volumes of renewable energy, so we currently carbon intensity per MWh of energy consumed values are make up for this by buying surplus renewable energy rounded to the nearest ten thousandth. in regions where it’s abundant. For example, by buying larger amounts of wind energy in places like Europe, we Total energy consumption is calculated as de昀椀ned compensate for our lack of renewable energy purchases by GRI Disclosure 302-1e-f. Total energy consumption in Asia. This approach results in our Scope 2 market-based includes all fuel and natural gas consumption, purchased emissions being greater than zero, per the Greenhouse electricity, purchased heating, and all electricity Gas Protocol Scope 2 Guidance, despite us achieving our generated on-site from renewable sources. Total 100% renewable energy match globally. electricity consumption is calculated as de昀椀ned by 89
Introduction Empowering individuals Working together Operating sustainably Governance and engagement Appendix 2023 Environmental Repo爀琀 Environmental data tables GHG EMISSIONS Unit 2018 2019 2020 2021 2022 146 Emission inventory 147 Scope 1 tCO2e 63,500 66,700 38,700 45,100 91,200 Scope 2 (location-based) tCO e 4,344,700 5,116,900 5,865,100 6,576,200 8,045,400 2 Impact of PPAs and market-based emissions factors tCO e -3,660,500 -4,322,700 -4,953,700 -4,753,100 -5,553,200 2 148 Scope 2 (market-based) tCO2e 684,200 794,300 911,400 1,823,100 2,492,200 Scope 3 (Category 2: Capital goods) 149 tCO e 3,709,000 2,157,000 1,809,000 1,676,000 2,096,000 2 Scope 3 (Category 4: Upstream transpo爀琀ation and distribution) tCO e 475,000 459,000 504,000 484,000 556,000 2 Scope 3 (Category 6: Business travel) tCO e 312,000 369,000 110,000 26,000 211,000 2 150 Scope 3 (Category 7: Employee commuting) tCO e 150,000 173,000 101,000 111,000 151,000 2 151 Scope 3 (Other categories) tCO e 8,252,000 8,509,000 6,848,000 7,206,000 4,586,000 2 Scope 3 (total) tCO2e 12,898,000 11,667,000 9,372,000 9,503,000 7,600,000 Total emissions: Scope 1, 2 (market-based), and 3 (total) tCO2e 13,645,700 12,528,000 10,322,100 11,371,200 10,183,400 Total operational emissions: Scope 1, 2 (market-based), tCO e 1,209,700 1,403,000 1,161,100 2,005,200 2,945,400 2 and 3 (business travel and employee commuting) Emissions compensated for by carbon credits tCO e -1,209,700 -1,403,000 -1,161,100 -2,005,200 -2,945,400 2 Total operational emissions a昀琀er emissions reductions and compensations tCO2e 0 0 0 0 0 Biogenic emissions tCO2 22,900 21,900 5,400 3,800 17,900 Carbon intensity Carbon intensity per unit of revenue tCO e/million U.S.$ 5.47 5.32 5.21 7.25 9.13 2 Carbon intensity per FTE employee tCO e/FTE 8.36 7.96 7.49 12.87 14.76 2 Carbon intensity per megawa琀琀-hour of energy consumed tCO e/MWh 0.0707 0.0675 0.0615 0.1006 0.1159 2 Assured for 2022 90
Introduction Empowering individuals Working together Operating sustainably Governance and engagement Appendix 2023 Environmental Repo爀琀 2022 154 Unit 2018 2019 2020 2021 2022 GHG EMISSIONS ENERGY Scope 2 Scope 2 Energy consumption 152 GHG emissions by type Unit Scope 1 (market-based) (location-based) Fuel MWh 468,200 366,400 181,800 205,200 374,800 CO tCO e 74,700 2,458,200 7,978,700 2 2 Purchased electricity 155 MWh 10,094,900 12,226,200 15,125,700 18,238,400 21,685,300 CH tCO e 200 3,400 15,100 4 2 Purchased heat MWh - 150,500 124,800 119,300 219,100 NO tCO e 200 8,100 29,100 2 2 On-site renewable electricity MWh 9,400 6,300 7,200 8,800 9,600 HFCs tCO e 16,100 22,500 22,500 2 Total energy consumption MWh 10,572,500 12,749,500 15,439,500 18,571,700 22,288,800 Total tCO2e 91,200 2,492,200 8,045,400 Electricity consumption Electricity consumption (U.S.) MWh 7,085,600 8,489,200 10,789,200 12,903,400 15,501,200 GHG EMISSIONS 2022 Electricity consumption MWh 3,018,700 3,748,000 4,349,300 5,383,700 6,275,000 Scope 2 Scope 2 (international) GHG emissions by region Unit Scope 1 156 (market-based) (location-based) Total electricity consumption MWh 10,104,300 12,237,200 15,138,500 18,287,100 21,776,200 No爀琀h America tCO e 62,100 1,228,900 5,990,900 2 Europe, Middle East, & Africa tCO e 20,900 27,300 685,200 Renewable energy 2 Latin America tCO e 1,600 9,400 138,500 Renewable energy contracts 2 MW 3,800 5,400 5,700 7,200 11,600 Asia Paci昀椀c tCO e 6,600 1,226,600 1,230,800 (cumulative) 2 Global total tCO e 91,200 2,492,200 8,045,400 2 Renewable electricity (PPAs) MWh 8,240,600 9,715,000 12,069,200 14,109,400 16,693,600 Renewable electricity (on-site) MWh 5,900 6,300 7,200 8,800 9,600 Renewable electricity (grid) MWh 1,857,800 2,515,900 3,062,100 4,168,900 5,073,000 ENERGY 2022 Total renewable electricity MWh 10,104,300 12,237,200 15,138,500 18,287,100 21,776,200 Electricity and Unit Total electricity Total renewable purchased 153 renewable energy by region energy allocated No爀琀h America MWh 15,585,100 11,288,200 Percentage of electricity procured % 100 100 100 100 100 157 from renewable sources Europe, Middle East, & Africa MWh 3,429,500 3,356,300 Latin America MWh 366,400 307,700 Asia Paci昀椀c MWh 2,395,200 10,800 Global total MWh 21,776,200 14,963,000 Assured for 2022 91
Introduction Empowering individuals Working together Operating sustainably Governance and engagement Appendix 2023 Environmental Repo爀琀 158, 159 Unit 2018 2019 2020 2021 2022 ENERGY EFFICIENCY (PUE) Country Location Belgium St. Ghislain PUE 1.09 1.09 1.08 1.08 1.09 Chile Quilicura PUE 1.12 1.09 1.08 1.09 1.09 Denmark Fredericia PUE - - - - 1.12 Finland Hamina PUE 1.09 1.09 1.09 1.09 1.09 Ireland Dublin PUE 1.11 1.12 1.09 1.09 1.09 Netherlands Eemshaven PUE 1.11 1.09 1.09 1.08 1.07 Singapore 1st facility PUE 1.18 1.15 1.14 1.13 1.13 Singapore 2nd facility PUE - - - - 1.21 Taiwan Changhua County PUE 1.14 1.13 1.13 1.12 1.12 United States Berkeley County, South Carolina PUE 1.12 1.11 1.11 1.1 1.1 United States Council Blu昀昀s, Iowa (1st facility) PUE 1.12 1.12 1.11 1.12 1.12 United States Council Blu昀昀s, Iowa (2nd facility) PUE 1.09 1.09 1.09 1.09 1.08 United States The Dalles, Oregon (1st facility) PUE 1.13 1.11 1.1 1.11 1.1 United States The Dalles, Oregon (2nd facility) PUE - 1.07 1.07 1.06 1.07 United States Douglas County, Georgia PUE 1.12 1.12 1.1 1.09 1.09 United States Henderson, Nevada PUE - - - - 1.11 United States Jackson County, Alabama PUE - - - 1.13 1.12 United States Lenoir, No爀琀h Carolina PUE 1.11 1.1 1.09 1.09 1.09 United States Loudoun County, Virginia (1st facility) PUE - - - 1.1 1.09 United States Loudoun County, Virginia (2nd facility) PUE - - - 1.13 1.09 United States Mayes County, Oklahoma PUE 1.1 1.10 1.12 1.1 1.1 United States Midlothian, Texas PUE - - - - 1.16 United States Montgomery County, Tennessee PUE - - - 1.1 1.11 United States New Albany, Ohio PUE - - - - 1.14 United States Papillion, Nebraska PUE - - - - 1.13 Average annual 昀氀eet-wide PUE across Google-owned and -operated data center campuses PUE 1.11 1.10 1.10 1.10 1.10 92
Introduction Empowering individuals Working together Operating sustainably Governance and engagement Appendix 2023 Environmental Repo爀琀 160, 161 Unit 2019 2020 2021 2022 CARBON-FREE ENERGY (CFE) CFE across Google data centers (hourly) % 61 67 66 64 CFE across Google o昀케ces (hourly) % - - - 56 CFE across Google data centers and o昀케ces (hourly) % - - - 64 2022 2022 DATA CENTER CARBON-FREE ENERGY DATA CENTER CARBON-FREE ENERGY 162 Country Regional grid Unit Grid CFE Google CFE 163 Country Regional grid Unit Grid CFE Google CFE Australia (New South Wales) Australian Energy Market Operator (AEMO), Australia % 27 27 Netherlands Tennet, Netherlands % 42 57 Australia (Victoria) Australian Energy Market Operator (AEMO), Australia % 34 34 Poland Polskie Sieci Elektroenergetyczne (PSE), Poland % 24 24 Belgium Elia, Belgium % 74 80 Singapore Energy Market Authority of Singapore, Singapore % 4 4 Brazil Operador Nacional do Sistema Elétrico (ONS), Brazil % 89 89 South Korea Korea Power Exchange (KPX), South Korea % 31 31 Canada The Independent Electricity System Operator (IESO), % 90 90 Spain Red Eléctrica, Spain % 67 67 Canada Switzerland Swissgrid, Switzerland % 85 85 Canada Hydro-Québec, Canada % 100 100 Taiwan Taiwan Power Company, Taiwan % 18 18 Chile Sistema Interconectado Central, Chile % 53 90 United States of America Bonneville Power Administration (BPA), U.S. % 89 89 Denmark Energinet, Denmark % 82 90 United States of America California Independent System Operator (CAISO), % 56 56 Finland Fingrid, Finland % 86 97 U.S. France Réseau de Transpo爀琀 d’Électricité (RTE), France % 87 87 United States of America Duke Energy Carolinas, U.S. % 59 63 Germany Germany % 56 96 United States of America Electric Reliability Council of Texas (ERCOT), U.S. % 41 41 Great Britain National Grid ESO, Great Britain % 58 85 United States of America Midcontinent Independent System Operator (MISO), % 35 96 Hong Kong Hong Kong % 28 28 U.S. India No爀琀h India Regional Grid, India % 23 23 United States of America Nevada Energy (NVE), U.S. % 27 27 India West India Regional Grid, India % 24 24 United States of America Paci昀椀Corp East (PACE), U.S. % 31 31 Indonesia Perusahaan Listrik Negara (PLN), Indonesia % 13 13 United States of America Pennsylvania, Jersey, Maryland Power Pool, (PJM), U.S. % 40 60 Ireland EirGrid, Ireland % 39 39 United States of America South Carolina Public Service Authority (Santee % 26 26 Israel Israel Electric Corporation (IEC) % 2 2 Cooper), U.S. Italy Terna, Italy % 42 42 United States of America Southern Company (SOCO), U.S. % 28 40 Japan Kansai Electric Power Company, Japan % 32 32 United States of America Southwest Power Pool (SPP), U.S. % 47 87 Japan TEPCO Power Grid, Japan % 16 16 United States of America Tennessee Valley Authority (TVA), U.S. % 52 63 93
Introduction Empowering individuals Working together Operating sustainably Governance and engagement Appendix 2023 Environmental Repo爀琀 WASTE Unit 2018 2019 2020 2021 2022 WATER 167 Unit 2018 2019 2020 2021 2022 168 Waste generation Global operational water 164 Waste generated Metric tons 57,100 48,100 28,900 28,200 38,200 Water consumption Million gallons - 3,412.4 3,748.9 4,561.8 5,564.7 Water discharge Million gallons - 1,748.3 1,939.8 1,734.8 2,034.9 Waste diversion Water withdrawal Million gallons 4,169.8 5,160.7 5,688.7 6,296.6 7,599.6 Land昀椀ll diversion rate (data centers) % 87 90 81 78 86 165 Land昀椀ll diversion rate (o昀케ces) % 76 71 71 64 75 169 Water replenishment Total land昀椀ll diversion rate % 80 77 77 77 84 Water replenished Million gallons - - - - 271.0 Contracted water replenishment Million gallons - - - - 1,317.2 capacity over lifetime of projects Data center hardware refurbishment and reuse Refurbished inventory used for server deployment, maintenance, % - - 10 13 21 166 and upgrades Components resold into the Million 3.5 10.0 8.2 4.9 5.0 secondary market components Assured for 2022 94
Introduction Empowering individuals Working together Operating sustainably Governance and engagement Appendix 2023 Environmental Repo爀琀 WATER USE BY 2022 WATER USE BY 2022 Golf course equivalents Golf course equivalents 170 175 DATA CENTER LOCATION DATA CENTER LOCATION 174 178 (estimated) (estimated) Location Unit Withdrawal Discharge Consumption Location Unit Withdrawal Discharge Consumption Ashburn, Virginia Million 48.8
Introduction Empowering individuals Working together Operating sustainably Governance and engagement Appendix 2023 Environmental Repo爀琀 Environmental repo爀琀ing frameworks index To determine what content to include in this repo爀琀, its seven principles for climate disclosure, and we believe transparency and climate repo爀琀ing. For our most recent our GHG emissions, science-based emissions reduction we considered global sustainability repo爀琀ing frameworks that our voluntary disclosures on climate-related ma琀琀ers CDP Climate Change Response, see our sustainability target, emissions reduction initiatives, low-carbon and guidelines, industry best practices, and stakeholder are consistent with the recommendations of the TCFD repo爀琀s page. products and services, value chain engagement, policy expectations. framework. advocacy and engagement, climate risk assessment, and Climate transition plan governance mechanisms. We maintain an ESG Index which maps our public Every year since 2009, we’ve publicly repo爀琀ed our disclosures to the Sustainable Accounting Standards carbon footprint to CDP (formerly known as the To see where elements of our climate transition plan In this repo爀琀, we’ve outlined elements of our climate Board (SASB) and to the Task Force on Climate-Related Carbon Disclosure Project). Since 2014, Alphabet has can be found, see repo爀琀 locations marked with ( ) transition plan that will help us make progress toward Financial Disclosures (TCFD) frameworks. We’ve formally been included on CDP’s Climate Change A-list eight in the tables below. our net-zero ambitions. This includes information about expressed suppo爀琀 for the TCFD repo爀琀ing framework and times, demonstrating our continued commitment to GENERAL Frameworks Environmental disclosure Topic 2023 Environmental Repo爀琀 location CDP Climate TCFD SASB category Statement from senior decision-maker • Introduction - Executive le琀琀ers C16. Signo昀昀 Strategy and governance Sustainability governance • Governance and engagement - Sustainability governance C1. Governance Governance: A, B • Appendix - Repo爀琀ing approach and methodology - Methodology C5. Emissions methodology Environmental accounting methodology Repo爀琀ing approach and methodology • Appendix - Repo爀琀ing approach and methodology - Methodology C10. Veri昀椀cation Third-pa爀琀y assurance Approach to stakeholder engagement • Governance and engagement - Stakeholder engagement C12. Engagement External engagement • Governance and engagement - Stakeholder engagement; Pa爀琀nerships • Empowering individuals Value chain engagement • Working together C12. Engagement • Operating sustainably Policy engagement • Governance and engagement - Public policy and advocacy C12. Engagement Trade association membership • Governance and engagement - Public policy and advocacy - Trade associations C12. Engagement and third-pa爀琀y groups • Governance and engagement - Public policy and advocacy; Pa爀琀nerships C12. Engagement Pa爀琀nerships • Governance and engagement - Public policy and advocacy; Pa爀琀nerships; External initiatives C12. Engagement Awards and recognition Denotes sections that contain elements of our climate transition plan 96
Introduction Empowering individuals Working together Operating sustainably Governance and engagement Appendix 2023 Environmental Repo爀琀 CLIMATE CHANGE Frameworks Environmental disclosure Topic 2023 Environmental Repo爀琀 location CDP Climate TCFD SASB category Our strategy • Operating sustainably - Net-zero carbon C3. Business strategy Governance and oversight Board and/or management oversight • Governance and engagement - Sustainability governance C1. Governance Governance: A, B Climate-related risks and oppo爀琀unities over di昀昀erent time horizons • Governance and engagement - Risk management - Climate-related risks C2. Risks and oppo爀琀unities Strategy: A, B Management approach Processes for identifying, assessing, and managing climate-related • Governance and engagement - Risk management - Climate-related risks C2. Risks and oppo爀琀unities Strategy: B risks and oppo爀琀unities for business strategy and 昀椀nancial planning Risk management: A, B, C Description of scenario analysis process, strategy, and results • Governance and engagement - Risk management - Climate-related risks C2. Risks and oppo爀琀unities Strategy: C C3. Business strategy Integration of climate-related risks and scenario analysis • Governance and engagement - Risk management - Climate-related risks C2. Risks and oppo爀琀unities Risk management: C into overall risk management and resiliency planning • Operating sustainably - Net-zero carbon - Our approach - Reducing carbon emissions - TC-IM-130a.3 Integration of environmental risks in data center planning C2. Risks and oppo爀琀unities Risk management: B Energy-e昀케cient and low-carbon facilities - Data centers TC-SI-130a.3 • Operating sustainably - Net-zero carbon - Reducing carbon emissions - Supplier engagement; Value chain engagement on climate change C12. Engagement Advancing carbon-free energy - CFE investments • Operating sustainably - Net-zero carbon - Advancing carbon-free energy - Transforming the energy system through pa爀琀nerships and advocacy Engagement with external targets and initiatives related to net zero • Working together - Our approach - Suppo爀琀 pa爀琀ners - Cloud customers and commercial C12. Engagement pa爀琀ners; Creating ecosystems for collaboration - Google.org; Google for Sta爀琀ups Engagement with public policy and trade associations on climate change • Governance and engagement - Public policy and advocacy C12. Engagement Goals and targets Energy- and emissions-related targets and progress against goals • Introduction - Targets and progress summary C4. Targets Metrics and targets: A, C • Appendix - Environmental data tables Scope 1, 2, and 3 emissions • Operating sustainably - Net-zero carbon - Our approach - Reducing carbon emissions - C7. Emissions breakdown Metrics and targets: A, B Pe爀昀ormance indicators Our emissions reduction goal • Appendix - Environmental data tables • Operating sustainably - Net-zero carbon - Our approach - Reducing carbon emissions - C9. Additional metrics Metrics and targets: A Average annual PUE Energy-e昀케cient and low-carbon facilities - Data centers • Appendix - Environmental data tables • Operating sustainably - Net-zero carbon - Our approach - Reducing carbon emissions - C6. Emissions data Metrics and targets: A Carbon intensity Our emissions reduction goal • Appendix - Environmental data tables C1. Governance TC-IM-130a.1 Carbon-free energy percentage • Operating sustainably - Net-zero carbon - Our approach - Advancing carbon-free energy C4. Targets and pe爀昀ormance Metrics and targets: A, C TC-SI-130a.1 C8. Energy Reduction of energy consumption within our organization • Operating sustainably - Net-zero carbon - Net-zero carbon - Our approach C2. Risks and oppo爀琀unities Metrics and targets: C Development of low-carbon products and services • Appendix - Environmental data tables C4.5 Low-carbon products Strategy: A • Operating sustainably - Net-zero carbon - Our approach • Appendix - Environmental data tables Emissions reductions, compensations, and removals for • Operating sustainably - Net-zero carbon - Our approach - Reducing carbon emissions; C6. Emissions data Metrics and targets: C our operations C11. Carbon pricing Advancing carbon-free energy • Appendix - Environmental data tables C2. Risks and oppo爀琀unities C3. Business strategy Renewable energy investments and contracts • Operating sustainably - Net-zero carbon - Our approach - Reducing carbon emissions; Metrics and targets: C C4. Targets and pe爀昀ormance Advancing carbon-free energy C6. Emissions data Denotes sections that contain elements of our climate transition plan 97
Introduction Empowering individuals Working together Operating sustainably Governance and engagement Appendix 2023 Environmental Repo爀琀 WATER Frameworks Environmental disclosure Topic 2023 Environmental Repo爀琀 location CDP Climate TCFD SASB category Our strategy • Operating sustainably - Water stewardship Governance and oversight Board and/or management oversight • Governance and engagement - Sustainability governance C1. Governance Processes for identifying, assessing, and managing water-related risks • Governance and engagement - Risk management - Water-related risks C3. Business strategy Management approach and oppo爀琀unities for business strategy and 昀椀nancial planning • Operating sustainably - Water stewardship - Our approach • Operating sustainably - Water stewardship - Our approach - Advancing responsible water TC-IM-130a.2 Water use from high-stress regions C3. Business strategy use; Bene昀椀ting watersheds and communities - Our water replenishment projects TC-SI-130a.2 • Operating sustainably - Water stewardship - Our approach - Advancing responsible water TC-IM-130a.3 C3. Business strategy Integration of environmental considerations into data center strategic planning use - Data centers TC-SI-130a.3 • Operating sustainably - Water stewardship - Our approach - Bene昀椀ting watersheds and Interactions with water as a shared resource communities • Operating sustainably - Water stewardship - Our approach - Advancing responsible water Value chain engagement on water-related issues C12. Engagement use - Supply chain • Operating sustainably - Water stewardship - Our approach - Bene昀椀ting watersheds and communities; Suppo爀琀ing water security with technology • Working together - Our approach - Suppo爀琀ing pa爀琀ners - Adaptation suppo爀琀 C12. Engagement Engagement with external targets and initiatives related to water stewardship for communities • Governance and engagement - Pa爀琀nerships Goals and targets Water-related targets and progress against goals • Operating sustainably - Water stewardship - Our approach • Introduction - Targets and progress summary • Introduction - Targets and progress summary TC-IM-130a.2 Pe爀昀ormance indicators Water consumption, withdrawal, and discharge • Appendix - Environmental data tables TC-SI-130a.2 MATERIALS Frameworks Environmental disclosure Topic 2023 Environmental Repo爀琀 location CDP Climate TCFD SASB category Our strategy • Operating sustainably - Circular economy Governance and oversight Board and/or management oversight • Governance and engagement - Sustainability governance C1. Governance • Operating sustainably - Circular economy - Our approach Approach to circular economy Management approach • Operating sustainably - Circular economy - Our approach - Reducing data center waste; TC-IM-130a.2 Circularity throughout our data centers, products, operations, Building circular workplaces and stores; Designing more sustainable consumer hardware TC-SI-130a.2 and workplaces products TC-IM-130a.3 Circularity throughout our value chain • Operating sustainably - Circular economy - Our approach - Working with suppliers TC-SI-130a.3 • Working together - Our approach - Suppo爀琀ing pa爀琀ners - Cloud customers and commercial pa爀琀ners - Responsible sourcing Engagement with external targets and initiatives related to circular economy • Governance and engagement - Pa爀琀nerships • Operating sustainably - Circular economy - Our approach Goals and targets Circular economy-related targets and progress against goals • Introduction - Targets and progress summary • Operating sustainably - Circular economy - Our approach 98
Introduction Empowering individuals Working together Operating sustainably Governance and engagement Appendix 2023 Environmental Repo爀琀 MATERIALS Frameworks Environmental disclosure Topic 2023 Environmental Repo爀琀 location CDP Climate TCFD SASB category • Operating sustainably - Circular economy - Our approach - Reducing data center waste - Data center hardware components refurbished or resold Zero Waste to Land昀椀ll Pe爀昀ormance indicators • Appendix - Environmental data tables • Operating sustainably - Net-zero carbon - Our approach - Reducing carbon emissions - LEED-ce爀琀i昀椀ed o昀케ce space Energy-e昀케cient and low-carbon facilities - O昀케ces • Appendix - Environmental data tables • Operating sustainably - Circular economy - Our approach - Reducing data center waste - Zero Waste to Land昀椀ll progress and ce爀琀i昀椀cations Zero Waste to Land昀椀ll; Working with suppliers - Manufacturing waste • Operating sustainably - Circular economy - Our approach - Building circular workplaces and stores - Workplace operations; Reducing data center waste - Zero Waste to Land昀椀ll Land昀椀ll diversion rate for o昀케ces and data centers • Appendix - Environmental data tables • Operating sustainably - Circular economy - Our approach - Building circular workplaces Food waste dive爀琀ed from land昀椀ll and stores - Workplace operations - Food waste NATURE AND BIODIVERSITY Frameworks Environmental disclosure Topic 2023 Environmental Repo爀琀 location CDP Climate TCFD SASB category Our strategy • Operating sustainably - Nature and biodiversity C2. Risks and oppo爀琀unities Governance and oversight C3. Business strategy • Governance and engagement - Sustainability governance C1. Governance Board and/or management oversight Integration of nature considerations into our buildings, operations, • Operating sustainably - Nature and biodiversity - Our approach - Building for biodiversity - C2. Risks and oppo爀琀unities Management approach and supply chain Designing for ecology; Bringing nature back to cities; Sourcing responsibly C3. Business strategy • Operating sustainably - Nature and biodiversity - Our approach - Protecting nature and making it more accessible; Developing technology to address biodiversity loss Nature-related adaptation and mitigation strategy and activities • Working together - Our approach - Suppo爀琀ing pa爀琀ners - Governments and C2. Risks and oppo爀琀unities C3. Business strategy intergovernmental organizations - Environmental Insights Explorer; Adaptation suppo爀琀 for communities; Investing in breakthrough innovation - Ocean ecosystems Approach to managing progress against internal and external • Operating sustainably - Nature and biodiversity - Our approach nature-related targets and expectations Engagement with external targets and initiatives related to nature • Working together - Our approach - Suppo爀琀ing pa爀琀ners - Governments and intergovernmental organizations; Researchers, academics, and NGOs C15. Biodiversity and biodiversity • Governance and engagement - Pa爀琀nerships Goals and targets Nature- and biodiversity-related targets and progress against goals • Introduction - Targets and progress summary C15. Biodiversity • Operating sustainably - Nature and biodiversity - Our approach - Building for biodiversity - C2. Risks and oppo爀琀unities Pe爀昀ormance indicators Native habitat restored and created on our Bay Area campuses C3. Business strategy Designing for ecology C15. Biodiversity Denotes sections that contain elements of our climate transition plan 99
Introduction Empowering individuals Working together Operating sustainably Governance and engagement Appendix 2023 Environmental Repo爀琀 SUPPLY CHAIN Frameworks Environmental disclosure Topic 2023 Environmental Repo爀琀 location CDP Climate TCFD SASB category Our strategy • Operating sustainably - Our operations; Net-zero carbon - Reducing carbon emissions - C12. Engagement Governance and oversight Supplier engagement • Governance and engagement C12. Engagement Board and/or management oversight Approach to supply chain risk environmental assessments and audits • Governance and engagement - Stakeholder engagement - Supplier engagement Management approach Integration of environmental factors within procurement policies • Operating sustainably - Net-zero carbon - Our approach - Reducing carbon emissions - Supplier engagement C12. Engagement and supplier contracts • Governance and engagement - Risk management • Operating sustainably - Net-zero carbon - Our approach - Reducing carbon emissions - Approach to supplier capacity building, training, and corrective Supplier engagement; Circular economy - Our approach - Working with suppliers - Safer chemistry action plans • Governance and engagement - Risk management; Stakeholder engagement - Supplier engagement • Working together - Our approach - Suppo爀琀ing pa爀琀ners - Cloud customers and Engagement with external targets and initiatives related to sustainable commercial pa爀琀ners C12. Engagement supply chains • Governance and engagement - Pa爀琀nerships Goals and targets Supplier environmental assessment-related targets • Introduction - Targets and progress summary • Operating sustainably - Circular economy - Our approach - Working with suppliers New suppliers that were screened using environmental criteria • Governance and engagement - Risk management C12. Engagement Pe爀昀ormance indicators • Operating sustainably - Net-zero carbon - Our approach - Advancing carbon-free energy - Supplier renewable energy C2. Risks and oppo爀琀unities CFE investments • Operating sustainably - Circular economy - Supply chain Negative environmental impacts in the supply chain and actions taken • Governance and engagement - Risk management Denotes sections that contain elements of our climate transition plan 100
Introduction Empowering individuals Working together Operating sustainably Governance and engagement Appendix 2023 Environmental Repo爀琀 third-pa爀琀y data centers. The 2022 data center CFE number represents a Google Search interest since 2004. distribution) to the amount of energy used to power IT equipment. A PUE of 2% change from 2021 (66% CFE), as a result of including third-pa爀琀y data 46 See endnote 35 above. 2.0 means that for every wa琀琀 of IT power, an additional wa琀琀 is consumed Endnotes centers. 47 See endnote 43 above. to cool and distribute power to the IT equipment. A PUE closer to 1.0 means 13 nearly all the energy is used for computing. Based on Google Trends data as of December 2022, when comparing 48 See endnote 35 above. 77 global Google Search interest since 2004. 49 “Measuring Fashion: Environmental Impact of the Global Apparel and According to the Uptime Institute’s 2022 Global Data Center Survey, the 14 See endnote 3 above. Footwear Industries Study,” Quantis, 2018. global average PUE of respondents’ data centers was around 1.55. 1 Throughout this repo爀琀, we use the term “sustainability” to refer to 50 78 15 See endnote 6 above. “Digital Transformation,” UNEP, April 2022. See endnote 19 above. environmental sustainability. 16 See endnote 7 above. 51 “Digital Decarbonisation: How the Digital Sector is Suppo爀琀ing Climate 79 Trailing 12-month PUE consists of the average PUE for the previous 12 2 Our pa爀琀ners include governments and intergovernmental organizations; 17 See endnote 8 above. Action,” Implement Consulting Group, 2022. months. customers and commercial pa爀琀ners; and researchers, academics, and 52 18 Based on Google’s analysis of tra昀케c pa琀琀erns before and a昀琀er “68% of the World Population Projected to Live in Urban Areas by 2050, 80 Data from repo爀琀ed po爀琀s for ChargePoint stations in the United States and non-governmental organizations. recommended adjustments to tra昀케c signals that were implemented during Says UN,” United Nations Depa爀琀ment of Economic and Social A昀昀airs, May Canada only are used to estimate emissions prevented from employee EV 3 Google uses a high-quality ML prediction model to estimate the expected 2018. tests conducted in 2022. commuting. fuel or energy consumption for each route option when users request 19 53 81 According to Google’s own analysis of our more e昀케cient servers, power SDG Indicators, United Nations: Unstats, 2022. Based on data collected from shu琀琀le commuting trips in the Bay Area, driving directions. We identify the route that we predict will consume the infrastructure, and cooling systems, compared with data center industry 54 “Izmir Sustainable Energy Climate Action Plan,” AECOM, 2020. as compared to a scenario in which these employees had each used a least amount of fuel or energy. If this route isn’t already the fastest one and averages. 55 See endnote 18 above. private, fuel-based car for commuting. Assumptions include average it o昀昀ers meaningful energy and fuel savings with only a small increase in 20 Googler commute distance, miles per gallon assumptions from the Bureau According to Google’s pla琀昀orm-neutral measurement for central 56 “Spreading Like Wild昀椀re: The Rising Threat of Extraordinary Landscape driving time, we recommend it to the user. To calculate enabled emissions of Transpo爀琀ation, and emissions per gallon of fuel assumptions from the processing unit (CPU) resources analyzed over a 昀椀ve-year period. Fires,” UNEP, 2022. reductions, we tally the fuel usage from the chosen fuel-e昀케cient routes 21 For more information on how we’re reducing the environmental footprint of 57 Our “Deep Learning for High-Resolution Wild昀椀re Modeling” research was Greenhouse Gas Protocol. Equivalency estimate is based on workdays in and subtract it from the predicted fuel consumption that would have the year, using data from “Greenhouse Gas Equivalencies Calculator,” U.S. our operations, see the Operating sustainably section. presented at the 2022 International Conference for Forest Fire Research. occurred on the fastest route without eco-friendly routing and apply 58 Environmental Protection Agency, accessed 2022. 22 “Japan’s Greenhouse Gas Emissions Rose 2% in FY21/22 as Economy “Number of deaths due to 昀氀oods worldwide from 1960 to 2020,” Statista, adjustments for factors such as: CO e factors, 昀氀eet factors, well-to-wheels 82 2 Recovered,” Reuters, April 2023. April 2023. See endnote 81 above. factors, and powe爀琀rain mismatch factors. We then input the estimated 23 59 See endnote 13 above. “Pa爀琀nering with Member States,” UNEP, 2021. 83 Carbon-free energy is any type of electricity generation that doesn’t prevented emissions into the EPA’s Greenhouse Gas Equivalencies 24 “Net Zero by 2050 - A Roadmap for the Global Energy Sector,” IEA, October 60 Pitney Bowes Parcel Shipping Index, 2021. directly emit carbon dioxide, including (but not limited to) solar, wind, Calculator to calculate equivalent cars o昀昀 the road for a year. The 2022 2021. 61 “Retail Speaks,” McKinsey & Company, 2021. geothermal, hydropower, and nuclear. Sustainable biomass and carbon 昀椀gure covers estimated emissions prevented a昀琀er eco-friendly routing was 25 2 capture and storage (CCS) are special cases considered on a case-by-case “CO and Greenhouse Gas Emissions,” OurWorldInData.org, 2020. 62 “Feasibility of A昀昀orestation as an Equitable Nature-Based Solution in Urban launched, from October 2021 through December 2022. Enabled emissions 26 Based on Google Trends data as of December 2022, when comparing Areas,” Sustainable Cities and Society, vol. 81, June 2022. basis, but are o昀琀en also considered carbon-free energy sources. reductions estimates include inherent unce爀琀ainty due to factors that 63 84 global Google Search interest since 2013. Based on Google Trends data as of December 2022, when comparing Alphabet’s renewable energy methodology is a custom calculation and is include the lack of primary data and precise information about real-world 27 See endnote 13 above. global Google Search interest in 2022 to that of 2021. based on a global approach. Percentage of renewable energy is calculated actions and their e昀昀ects. These factors contribute to a range of possible 28 See endnote 6 above. 64 See endnote 35 above. on a calendar-year basis, dividing the volume of renewable electricity outcomes, within which we repo爀琀 a central value. 29 See endnote 7 above. 65 Some of our locations have more than one data center campus, and others (in megawa琀琀-hours) procured for our global operations (i.e., renewable 4 This estimated spend is based on contracts signed to purchase clean 30 See endnote 8 above. weren’t yet operational during 2022. energy procured through our PPA contracts, on-site renewable energy energy for our operations. Actual spend may vary from these estimates 31 See endnote 6 above. 66 “Climate Change 2022: Impacts, Adaptation and Vulnerability generation, and renewable energy in the electric grids where our facilities based on changes in renewable electricity output from operational 32 Nest Renew Energy Shi昀琀 usage re昀氀ects the total number of hours Working Group II Contribution to the Sixth Assessment Repo爀琀 of the are located) by the total volume of electricity consumed by our global projects, the number of contracts signed, and energy market prices. operations. The numerator includes all renewable energy procured, Intergovernmental Panel on Climate Change,” IPCC, 2022. thermostats enrolled in Nest Renew ran Energy Shi昀琀 features to prioritize 5 See endnote 3 above. cleaner or cheaper energy during 2022. 67 “Climate Commitments Not On Track to Meet Paris Agreement Goals regardless of the market in which the renewable energy was consumed. 6 Estimated energy savings are calculated based on the typical percentage 33 Additional details on Alphabet’s criteria and methodology can be found in Nest Renew users include anyone in the continental U.S. with a 3rd as NDC Synthesis Repo爀琀 is Published,” United Nations Climate Change, of heating and cooling savings found in real-world studies of the Nest the “Achieving Our 100% Renewable Energy Purchasing Goal and Going February 2021. generation Nest Learning Thermostat, the Nest Thermostat E, or the Learning Thermostat. To calculate the total Nest savings, we apply these 68 Beyond” disclosure. newest Nest Thermostat connected to a Google account. “Is Carbon Capture Too Expensive?” IEA, February 2021. savings percentages to the actual heating and cooling hours of all Nest 34 85 See endnote 6 above. 69 See the Environmental data tables for Carbon intensity per unit of revenue For example, research by Princeton University and TU Berlin has shown that thermostats. 35 Based on Google Trends data as of December 2022, when comparing for 2022 (9.13 tCO2e/million U.S.$). Our 2011 carbon intensity factor was hourly (24/7) carbon-free energy goals have a greater impact on grid-level 7 “Po爀琀ugal - Countries & Regions,” IEA, 2021. decarbonization than the prevailing approach of 100% annual renewable global Google Search interest since 2008. repo爀琀ed in prior Environmental Repo爀琀s as 38.8 (tCO2e of gross global 8 The enabled emissions reductions are calculated based on these energy 36 See endnote 13 above. combined Scope 1 and market-based Scope 2 emissions/million U.S.$). energy matching. savings, applying standard emission factors for fossil fuels, and using U.S. 70 86 37 See endnote 35 above. This third-pa爀琀y projection is based on a 2020 whole-building LCA, See endnote 4 above. EPA AVERT marginal emissions for the 95% of electricity savings that occur 38 “Transpo爀琀: Improving the Sustainability of Passenger and Freight following the LEED v4 Building Life Cycle Impact Reduction requirements. 87 See endnote 4 above. in the U.S., with an adjusted value for the 5% of electricity savings outside Transpo爀琀,” IEA, 2022. The interior design was not factored into this LCA. 88 “Greenhouse Gas Equivalencies Calculator,” EPA, accessed 2022. the U.S. 39 71 Based on Google Trends data as of April 2023, when comparing global Refrigerants used in HVAC and refrigeration equipment are o昀琀en synthetic 89 Our CFE percentage measures the degree to which our electricity 9 For products launched in 2022: Pixel, Nest, and Chromecast devices are Google Search interest from April 2022–April 2023 to that of April 2021– compounds commonly referred to as super pollutants because their global consumption on a given regional grid is matched with CFE on an hourly made with recycled materials ranging between 9% and 60% based on April 2022. warming potential is signi昀椀cantly higher than other GHGs like carbon basis. This is calculated using both CFE under contract by Google as well respective product weights. 40 dioxide. as CFE coming from the overall grid mix. CFE coming from the overall grid See endnote 3 above. 10 Unique, signed-in Google users that were provided information to make a 72 mix is based on data obtained from a third pa爀琀y, Electricity Maps, and has 41 “Global EV Outlook 2023 Abstract,” IEA, April 2023. “The Carbon Footprint of Machine Learning Training Will Plateau, Then more sustainable choice by at least one sustainable product feature. 42 See endnote 13 above. Shrink,” Computer, vol. 55, July 2022. not been assured. For more information, see our 2021 white paper, “24/7 11 Due to a methodology change, we’re not repo爀琀ing a percent progress 73 Carbon-Free Energy: Methodologies and Metrics.” 43 Based on Google Trends data as of April 2023, when comparing global See endnote 20 above. towards this target and have instead provided our total GHG emissions 90 Google Search interest from April 2020–April 2023 to that of April 2017– 74 See endnote 19 above. A grid region (or regional grid) corresponds to the area over which a (Scope 1, 2 (market-based), and 3) in 2022. April 2020. 75 See endnote 20 above. single entity manages the operation of the electric power system and 12 In 2022, we expanded our carbon-free energy repo爀琀ing from only 44 See endnote 13 above. 76 PUE is a standard industry ratio that compares the amount of non- ensures that demand and supply are 昀椀nely balanced. In the United States, Google-owned and -operated data centers to also incorporate o昀케ces and 45 Based on Google Trends data as of April 2023, when comparing global computing overhead energy (used for things like cooling and power this generally means the ISO or RTO in regions that have these regional 101
Introduction Empowering individuals Working together Operating sustainably Governance and engagement Appendix 2023 Environmental Repo爀琀 market structures. If no such structure exists, then Google de昀椀nes the grid Search interest from April 2018–April 2023 to that of April 2013–April 2018. variations. Doesn’t include stand-alone accessory products other than not emi琀琀ed as a result of our operations. region as the electricity-balancing authority where our data centers are 112 See endnote 35 above. Pixel phone cases, and Pixel Watch Active, Stretch, and Woven bands. 153 “Total renewable energy allocated” includes the total amount of renewable located. Outside of the United States, the grid region most o昀琀en refers to 127 113 “Impo爀琀ance of Methane,” EPA, 2021. Based on U.S. retail packaging weight with adhesive materials excluded. electricity generation conveyed via contractual instruments, which have the geographic boundary of a country, because most grid system operators 114 Percent reduction in food waste per Googler was calculated as food waste To meet the request of some clients, plastic stickers are applied to some been used in the calculation of Scope 2 market-based emissions per the operate at the national level. Ce爀琀ain regions that span multiple countries Greenhouse Gas Protocol Scope 2 Quality Criteria. generated in kitchens and cafes at Google’s global o昀케ces per unique packaging variations. are well interconnected and could be considered as one grid; however, 128 154 badge swipes, against a 2019 baseline. See endnote 127 above. Repo爀琀ed energy values (in MW or MWh) are rounded to the nearest 100. our grid mix calculations already include impo爀琀 and expo爀琀 considerations 115 “A Whopping 91 Percent of Plastic Isn’t Recycled,” National Geographic, 129 See endnote 126 above. 155 “Purchased electricity” is electricity sourced from an electrical grid and and therefore take into account power 昀氀ows from neighboring grids. In December 2018. 130 See Learn when you’ll get so昀琀ware updates on Google Pixel phones for purchased from a local electric utility company. This metric di昀昀ers slightly the future, we may update our de昀椀nition as we work with grid operators to 116 UL110 and IEEE 1680.1 are multi-a琀琀ribute, consensus-based sustainability more details. from “Total electricity consumption,” which includes both purchased and be琀琀er understand how transmission constraints or congestion impact CFE 131 self-generated electricity. standards for mobile phones and for computers and displays, respectively. We o昀昀er free recycling for eligible products from any brand. Learn more measurement within and across grid regions. 156 Google uses a third pa爀琀y to validate conformance and independently about Google’s recycling program on our site. See endnote 155 above. 91 Contracted CFE is the hourly electricity production from clean energy ce爀琀ify to these standards. See UL Spot Database. 132 Learn more about UL 2799 Zero Waste to Land昀椀ll ce爀琀i昀椀cation. 157 See the Methodology section for an overview of our “percentage of 117 projects whose electricity and associated environmental a琀琀ributes are Carbon footprint reduction claim based on third-pa爀琀y veri昀椀ed life 133 See endnote 108 above. electricity procured from renewable sources” calculation. 158 contracted to Google via power purchase agreements, retail energy supply cycle assessment. Recycled aluminum in the enclosures is at least 9% of 134 “A Warning Sign: Where Biodiversity Loss Is Happening Around the World,” We repo爀琀 individual campus PUE only for campuses with at least twelve arrangements, or other contractual structures. See “24/7 Carbon-Free applicable product based on weight. World Wildlife Fund, 2021. months of data. All repo爀琀ed PUE values are rounded to the hundredths place. Energy: Methodologies and Metrics” for more details. 118 135 Doesn’t include third-pa爀琀y products such as the Nest x Yale Lock. See endnote 134 above. 159 See endnote 76 above. 92 “Why Did Renewables Become so Cheap so Fast?” Our World in Data, 119 For products launched in 2020 and 2021: Nest, Pixel, and Chromecast 136 “From Savanna to Suburb: E昀昀ects of 160 Years of Landscape Change 160 See endnote 89 above. December 2020. devices are made with recycled plastic ranging between 9% and 68% on Carbon Storage in Silicon Valley, California,” Landscape and Urban 161 See endnote 12 above. 93 Planning, vol. 195, March 2020. See endnote 13 above. based on weight of plastic used in each respective product launched 162 See endnote 90 above. during this timeframe. The following items are excluded: plastics in printed 137 94 “How the Tech Sector Can Drive Renewable Energy Oppo爀琀unities in APAC,” “Charleston Retention Basin Improvement Project,” California 163 See endnote 90 above. ENGIE Impact, accessed 2023. circuit boards, labels, cables, connectors, electronic components and Environmental Quality Act, accessed 2023. 164 Repo爀琀ed waste generated values are rounded to the nearest hundred. 95 modules, optical components, electrostatic discharge (ESD) components, 138 “Climate Change 2022: Mitigation of Climate Change Summary for “Western Monarch Thanksgiving Count Tallies Over 330,000 Bu琀琀e爀昀lies 165 Land昀椀ll diversion is calculated as waste dive爀琀ed to a more sustainable electromagnetic inte爀昀erence (EMI) components, 昀椀lms, coatings and Policymakers,” IPCC, 2022. Before Storms Ba琀琀er Overwintering Sites,” Xerces Society, 2023. pathway than land昀椀ll, as a percentage of total waste. Sta爀琀ing in 2022, we’ve 96 adhesives. For products launched in 2022: Pixel, Nest, and Chromecast 139 “Turning the Tide,” Global Commission on the Economics of Water, 2023. See endnote 13 above. updated our land昀椀ll diversion rate methodology for our o昀케ce operations by devices are made with recycled materials ranging between 9% and 60% 97 We de昀椀ne freshwater as naturally occurring water from su爀昀ace or 140 “Reduce Urban Heat Island E昀昀ect,” EPA, May 2019. removing contamination from our recycling and compost streams, providing based on respective product weights. groundwater sources that isn’t salty, and is suitable for consumption if clean 141 The percentage of FSC-ce爀琀i昀椀ed wood used at Bay View and Charleston a more accurate representation of land昀椀ll avoidance, and suppo爀琀ing our 120 e昀昀o爀琀s to maintain high-quality dive爀琀ed materials. or processed. Freshwater excludes seawater and reclaimed wastewater. Based on total plastic weight of (A) Google Pixel, Nest, and Chromecast East is calculated based on material costs for new wood purchased for 98 166 Based on the average annual irrigation of golf courses in the southwest U.S. products manufactured in 2022 and (B) Fitbit products launched and these projects during construction. We expanded this data center hardware refurbishment key pe爀昀ormance 142 of 459 acre-昀琀 or around 150 million gallons. Source: “How Much Water Does manufactured in 2022. Includes U.S. con昀椀guration of in-box accessories See endnote 141 above. indicator from including only decommissioned pa爀琀s that were reused for Golf Use and Where Does It Come From?” U.S. Golf Association, 2012. but does not include standalone accessory products other than Pixel 143 “Paris Agreement,” UNFCCC, 2015. server maintenance to also including other refurbished pa爀琀 types reused for 99 phone cases, and Pixel Watch Active, Stretch, and Woven bands. This does server maintenance as well as server deployment and upgrades. This change Based on the WRI Aqueduct Water Risk Atlas tool, we de昀椀ne “high water 144 “Summary for Policymakers of IPCC Special Repo爀琀 on Global Warming of not include plastics in printed circuit boards, labels, cables, connectors, more accurately re昀氀ects Google’s approach to data center material reuse. stress” as areas with high or extremely high overall water stress, and “low water 1.5°C Approved by Governments,” IPCC, 2018. stress” as areas with low, low-medium, or medium-high overall water stress. electronic components and modules, optical components, electrostatic 145 167 “Sixth Assessment Repo爀琀,” IPCC, 2019. All repo爀琀ed water values are rounded to the nearest hundred thousand 100 discharge (ESD) components, electromagnetic inte爀昀erence (EMI) According to Google’s own analysis of our data center energy use and 146 All repo爀琀ed Scope 1 GHG emissions, Scope 2 GHG emissions, and gallons and repo爀琀ed in million gallons. carbon emissions in 2021. components, 昀椀lms, coatings, and adhesives. biogenic emissions values are rounded to the nearest hundred. All 168 In 2019, we aligned our water repo爀琀ing with industry standards to disclose 121 101 We contracted a third-pa爀琀y to quantify volumetric bene昀椀ts by applying Based on total weight of new Google Pixel, Nest, Chromecast, and Fitbit repo爀琀ed Scope 3 emissions values are rounded to the nearest thousand. three water indicators: total water withdrawal, consumption, and discharge. 147 industry standard methodologies and defensible data and assumptions. products launched and manufactured in 2022, including U.S. con昀椀guration In 2022, we included estimates for hydro昀氀uorocarbon (HFC) emissions Data for total water consumption and total water discharge is not available 102 See endnote 101 above. of in-box accessories. Does not include standalone accessory products resulting from the leakage of refrigerants from cooling equipment at our for prior years. Our repo爀琀ed water metrics don’t include seawater. 103 See endnote 35 above. other than Pixel phone cases, and Pixel Watch Active, Stretch, and Woven o昀케ces and data centers in our Scope 1 emissions. We have not updated 169 We contracted a third pa爀琀y to quantify volumetric bene昀椀ts by applying 104 See endnote 63 above. bands. prior years to include estimated refrigerant emissions. industry standard methodologies and defensible data and assumptions. 122 148 105 “Ea爀琀h Overshoot Day,” Global Footprint Network, 2023. Carbon footprint reduction claim based on third-pa爀琀y-veri昀椀ed life Our Scope 2 market-based emissions increased 37%, primarily due to See the Bene昀椀ting watersheds and communities section for more details. 106 “The Circular Economy Could Unlock $4.5 Trillion of Economic Growth, Finds cycle assessment. Recycled aluminum in the enclosures is at least 9% of increased data center electricity consumption and a lack of full regional 170 Our repo爀琀ed water metrics don’t include seawater. All repo爀琀ed water New Book by Accenture,” Accenture, 2015. applicable product based on weight. coverage of renewable energy procurement in the United States and Asia values are rounded to the nearest hundred thousand gallons and repo爀琀ed in 107 123 Paci昀椀c regions. “How the Circular Economy Tackles Climate Change,” Ellen MacA爀琀hur See endnote 122 above. million gallons. 149 171 Foundation, 2021. 124 See endnote 120 above. Ce爀琀ain Category 1: “Purchased goods and services” emissions are Treated wastewater from the Sweetwater Creek Sidestream Reuse Facility. 108 “Building a World Free from Waste and Pollution,” Ellen MacA爀琀hur 125 The following may be excluded from the calculation of percentage: printed presented in Category 2: “Capital goods.” See the Methodology section 172 Air-cooled facility; no water used for cooling. Foundation, 2021. circuit boards, labels, cables, connectors, electronic components and for more details. 173 Industrial water supplied by No爀琀h Water. 109 150 “Circular Economy of Construction and Demolition Waste: A Literature modules, optical components, electrostatic discharge components, In 2022, we updated our Scope 3 Category 7: “Employee commuting” 174 See endnote 98 above. Review on Lessons, Challenges, and Bene昀椀ts,” NIH National Library of electromagnetic inte爀昀erence components, 昀椀lms, coatings, and adhesives. methodology to estimate additional modes of transpo爀琀ation due to the 175 See endnote 170 above. Medicine, 2021. Renewable content consists of plastic made from bio-based material. availability of new data sources. See the Methodology section for more 176 Water drawn from the Nimy-Blaton-Peronnes shipping canal and treated 110 Does not include third-pa爀琀y products such as the Nest x Yale Lock. details. We’ve assessed contamination rates for our recycling and composting on-site. 126 151 streams and removed them from our calculation. This contrasts with our Based on total weight of new Google Pixel, Nest, Chromecast, and Fitbit We present ce爀琀ain Scope 3 emissions from Category 1, Category 2, 177 See endnote 172 above. historical methodology and the industry standard diversion rate, which retail packaging (excluding adhesive materials) for products launched and Category 11, and Category 12 as an aggregated subtotal “Other categories” 178 See endnote 98 above. assumes that anything placed in recycling or compost bins has zero manufactured in 2022, as shipped by Google. Due to global variations in for business reasons, as described fu爀琀her in the Methodology section. contamination. packaging, U.S. retail packaging data is used for our repo爀琀ing. To meet the 152 Other GHGs, including pe爀昀luorocarbons (PFCs), sulfur hexa昀氀uoride (SF ), 6 111 request of some clients, plastic stickers are applied to some packaging Based on Google Trends data as of April 2023, when comparing global Google and nitrogen tri昀氀uoride (NF3), are not included in our inventory, as they’re 102
Introduction Empowering individuals Working together Operating sustainably Governance and engagement Appendix 2023 Environmental Repo爀琀 Glossary Photo details On the cover: AI: a爀琀i昀椀cial intelligence lb: pound Google Ea爀琀h image of Soalala, Madagascar ©2015 DigitalGlobe Bay View: our Bay View campus in Mountain View, LBC: Living Building Challenge Table of contents: No爀琀her O昀昀shore wind farm in Belgium (92 MW for Google) California LCA: life cycle assessment Introduction: CDP: formerly known as the Carbon Disclosure Project LEED: Leadership in Energy and Environmental Design Googlers in a cou爀琀yard at our new campus in Mountain View, California. CDR: carbon dioxide removal m: meter A le琀琀er from our Chief Sustainability O昀케cer: Photo by Vaughn Ridley/Spo爀琀s昀椀le for Web Summit via Ge琀琀y Images CFE: carbon-free energy ML: machine learning Empowering individuals: CO2e: carbon dioxide equivalent MW: megawa琀琀 A parking lot full of electric vehicles lined up outside a Google o昀케ce, plugged into charging stations. EIE: Environmental Insights Explorer MWh: megawa琀琀-hour Working together: Satellite-derived Ea爀琀h Engine image showing seasonal agricultural peaks EPA: U.S. Environmental Protection Agency NGO: non-governmental organization near the Columbia and Snake Rivers in Washington state. The pe爀昀ectly ESG: environmental, social and governance round 昀椀elds are center pivot irrigated corn and wheat maturing in di昀昀erent PPA: power purchase agreement months. Data source: Landsat 8, U.S. Geological Survey. EV: electric vehicle PUE: power usage e昀昀ectiveness Operating sustainably: 昀琀: foot SDGs: Sustainable Development Goals A view of our Bay View campus with the events center in the foreground and a Google brandmark sculpture. (Photo: Iwan Baan) FSC: Forest Stewardship Council tCO e: metric tons of carbon dioxide equivalent 2 Net-zero carbon: GHG: greenhouse gas TCFD: Task Force on Climate-Related Financial Golden Hills wind farm in California (43 MW for Google) Water stewardship: GHGP: Greenhouse Gas Protocol Disclosures Our Bay View campus, as seen from across its stormwater retention pond. GT: gigaton TWh: terawa琀琀-hour (Photo: Iwan Baan) GW: gigawa琀琀 WBCSD: World Business Council for Sustainable Circular economy: A closeup of many small, broken circuit boards in a pile. Our approach Development GWP: global warming potential to circularity for data center equipment is to maintain components for WRI: World Resources Institute as long as possible, refurbish components for future reuse, reuse or IEA: International Energy Agency resell components following a rigorous security process, and recycle any components that can’t be reused. ILFI: International Living Future Institute UNEP: United Nations Environment Programme UNFCC: United Nations Framework Convention on Nature and biodiversity: IPCC: Intergovernmental Panel on Climate Change The design of the Charleston Retention Basin on our Mountain View Climate Change ISO: International Organization for Standardization Campus allows visitors to experience, learn about, and enjoy the expanded riparian habitat. kg: kilogram X: Alphabet’s “moonshot factory” Governance and engagement: km: kilometer Googlers collaborate in a common space in one of our o昀케ces. Appendix: kWh: kilowa琀琀-hour A bright, colo爀昀ul wall in a Google o昀케ce. 103
Environmental Repo爀琀 2023 Want to learn more about our latest e昀昀o爀琀s? To stay up to date on our news and progress, see our Sustainability blog. Publication date: July 2023