
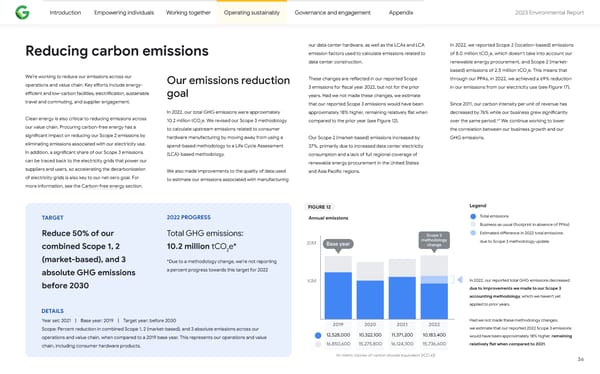
Introduction Empowering individuals Working together Operating sustainably Governance and engagement Appendix 2023 Environmental Repo爀琀 our data center hardware, as well as the LCAs and LCA In 2022, we repo爀琀ed Scope 2 (location-based) emissions Reducing carbon emissions emission factors used to calculate emissions related to of 8.0 million tCO e, which doesn’t take into account our 2 data center construction. renewable energy procurement, and Scope 2 (market- based) emissions of 2.5 million tCO e. This means that 2 We’re working to reduce our emissions across our Our emissions reduction These changes are re昀氀ected in our repo爀琀ed Scope through our PPAs, in 2022, we achieved a 69% reduction operations and value chain. Key e昀昀o爀琀s include energy- 3 emissions for 昀椀scal year 2022, but not for the prior in our emissions from our electricity use (see Figure 17). e昀케cient and low-carbon facilities, electri昀椀cation, sustainable goal years. Had we not made these changes, we estimate travel and commuting, and supplier engagement. that our repo爀琀ed Scope 3 emissions would have been Since 2011, our carbon intensity per unit of revenue has In 2022, our total GHG emissions were approximately approximately 18% higher, remaining relatively 昀氀at when decreased by 76% while our business grew signi昀椀cantly Clean energy is also critical to reducing emissions across 69 10.2 million tCO e. We revised our Scope 3 methodology compared to the prior year (see Figure 12). over the same period. We continue working to lower 2 our value chain. Procuring carbon-free energy has a to calculate upstream emissions related to consumer the correlation between our business growth and our signi昀椀cant impact on reducing our Scope 2 emissions by hardware manufacturing by moving away from using a Our Scope 2 (market-based) emissions increased by GHG emissions. eliminating emissions associated with our electricity use. spend-based methodology to a Life Cycle Assessment 37%, primarily due to increased data center electricity In addition, a signi昀椀cant share of our Scope 3 emissions (LCA)-based methodology. consumption and a lack of full regional coverage of can be traced back to the electricity grids that power our renewable energy procurement in the United States suppliers and users, so accelerating the decarbonization We also made improvements to the quality of data used and Asia Paci昀椀c regions. of electricity grids is also key to our net-zero goal. For to estimate our emissions associated with manufacturing more information, see the Carbon-free energy section. FIGURE 12 Legend Total emissions TARGET 2022 PROGRESS Annual emissions Business as usual (footprint in absence of PPAs) Estimated di昀昀erence in 2022 total emissions Reduce 50% of our Total GHG emissions: Scope 3 methodology combined Scope 1, 2 10.2 million tCO e* 20M Base year change due to Scope 3 methodology update 2 (market-based), and 3 *Due to a methodology change, we’re not repo爀琀ing absolute GHG emissions a percent progress towards this target for 2022 10M In 2022, our repo爀琀ed total GHG emissions decreased before 2030 due to improvements we made to our Scope 3 accounting methodology, which we haven’t yet applied to prior years. DETAILS Had we not made these methodology changes, Year set: 2021 | Base year: 2019 | Target year: before 2030 2019 2020 2021 2022 we estimate that our repo爀琀ed 2022 Scope 3 emissions Scope: Percent reduction in combined Scope 1, 2 (market-based), and 3 absolute emissions across our 12,528,000 10,322,100 11,371,200 10,183,400 would have been approximately 18% higher, remaining operations and value chain, when compared to a 2019 base year. This represents our operations and value 16,850,600 15,275,800 16,124,300 15,736,600 relatively 昀氀at when compared to 2021. chain, including consumer hardware products. (in metric tonnes of carbon dioxide equivalent [tCOe]) 2 36
 2023 Environmental Report Page 35 Page 37