
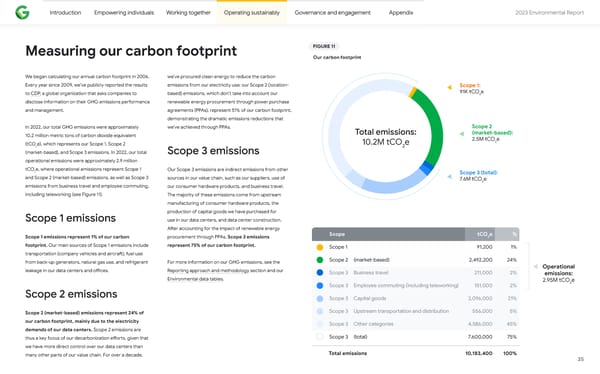
Introduction Empowering individuals Working together Operating sustainably Governance and engagement Appendix 2023 Environmental Repo爀琀 FIGURE 11 Measuring our carbon footprint Our carbon footprint We began calculating our annual carbon footprint in 2006. we’ve procured clean energy to reduce the carbon Every year since 2009, we’ve publicly repo爀琀ed the results emissions from our electricity use: our Scope 2 (location- Scope 1: 91K tCO e to CDP, a global organization that asks companies to based) emissions, which don’t take into account our 2 disclose information on their GHG emissions pe爀昀ormance renewable energy procurement through power purchase and management. agreements (PPAs), represent 51% of our carbon footprint, demonstrating the dramatic emissions reductions that In 2022, our total GHG emissions were approximately we’ve achieved through PPAs. Scope 2 Total emissions: (market-based): 10.2 million metric tons of carbon dioxide equivalent 2.5M tCO e (tCO e), which represents our Scope 1, Scope 2 10.2M tCO e 2 2 2 (market-based), and Scope 3 emissions. In 2022, our total Scope 3 emissions operational emissions were approximately 2.9 million tCO e, where operational emissions represent Scope 1 2 Our Scope 3 emissions are indirect emissions from other Scope 3 (total): and Scope 2 (market-based) emissions, as well as Scope 3 sources in our value chain, such as our suppliers, use of 7.6M tCO2e emissions from business travel and employee commuting, our consumer hardware products, and business travel. including teleworking (see Figure 11). The majority of these emissions come from upstream manufacturing of consumer hardware products, the production of capital goods we have purchased for Scope 1 emissions use in our data centers, and data center construction. A昀琀er accounting for the impact of renewable energy Scope 1 emissions represent 1% of our carbon procurement through PPAs, Scope 3 emissions Scope tCO2e % footprint. Our main sources of Scope 1 emissions include represent 75% of our carbon footprint. Scope 1 91,200 1% transpo爀琀ation (company vehicles and aircra昀琀), fuel use Scope 2 (market-based) 2,492,200 24% from back-up generators, natural gas use, and refrigerant For more information on our GHG emissions, see the Operational leakage in our data centers and o昀케ces. Repo爀琀ing approach and methodology section and our Scope 3 Business travel 211,000 2% emissions: Environmental data tables. 2.95M tCO e Scope 3 Employee commuting (including teleworking) 151,000 2% 2 Scope 2 emissions Scope 3 Capital goods 2,096,000 21% Scope 3 Upstream transpo爀琀ation and distribution 556,000 5% Scope 2 (market-based) emissions represent 24% of our carbon footprint, mainly due to the electricity Scope 3 Other categories 4,586,000 45% demands of our data centers. Scope 2 emissions are Scope 3 (total) 7,600,000 75% thus a key focus of our decarbonization e昀昀o爀琀s, given that we have more direct control over our data centers than Total emissions 10,183,400 100% many other pa爀琀s of our value chain. For over a decade, 35
 2023 Environmental Report Page 34 Page 36