
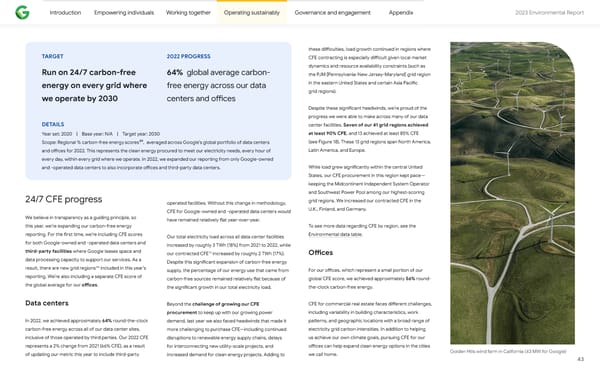
Introduction Empowering individuals Working together Operating sustainably Governance and engagement Appendix 2023 Environmental Repo爀琀 these di昀케culties, load growth continued in regions where TARGET 2022 PROGRESS CFE contracting is especially di昀케cult given local market Run on 24/7 carbon-free 64% global average carbon- dynamics and resource availability constraints (such as the PJM [Pennsylvania-New Jersey-Maryland] grid region energy on every grid where free energy across our data in the eastern United States and ce爀琀ain Asia Paci昀椀c grid regions). we operate by 2030 centers and o昀케ces Despite these signi昀椀cant headwinds, we’re proud of the progress we were able to make across many of our data DETAILS center facilities. Seven of our 41 grid regions achieved at least 90% CFE, and 13 achieved at least 85% CFE Year set: 2020 | Base year: N/A | Target year: 2030 89 Scope: Regional % carbon-free energyscores , averaged across Google’s global po爀琀folio of data centers (see Figure 18). These 13 grid regions span No爀琀h America, Latin America, and Europe. and o昀케ces for 2022. This represents the clean energy procured to meet our electricity needs, every hour of every day, within every grid where we operate. In 2022, we expanded our repo爀琀ing from only Google-owned While load grew signi昀椀cantly within the central United and -operated data centers to also incorporate o昀케ces and third-pa爀琀y data centers. States, our CFE procurement in this region kept pace— keeping the Midcontinent Independent System Operator and Southwest Power Pool among our highest-scoring 24/7 CFE progress grid regions. We increased our contracted CFE in the operated facilities. Without this change in methodology, U.K., Finland, and Germany. CFE for Google-owned and -operated data centers would We believe in transparency as a guiding principle, so have remained relatively 昀氀at year-over-year. this year, we’re expanding our carbon-free energy To see more data regarding CFE by region, see the repo爀琀ing. For the 昀椀rst time, we’re including CFE scores Environmental data table. Our total electricity load across all data center facilities for both Google-owned and -operated data centers and increased by roughly 3 TWh (18%) from 2021 to 2022, while third-pa爀琀y facilities where Google leases space and 91 O昀케ces our contracted CFE increased by roughly 2 TWh (17%). data processing capacity to suppo爀琀 our services. As a Despite this signi昀椀cant expansion of carbon-free energy 90 result, there are new grid regions included in this year’s For our o昀케ces, which represent a small po爀琀ion of our supply, the percentage of our energy use that came from repo爀琀ing. We’re also including a separate CFE score of global CFE score, we achieved approximately 56% round- carbon-free sources remained relatively 昀氀at because of the global average for our o昀케ces. the-clock carbon-free energy. the signi昀椀cant growth in our total electricity load. Data centers Beyond the challenge of growing our CFE CFE for commercial real estate faces di昀昀erent challenges, procurement to keep up with our growing power including variability in building characteristics, work In 2022, we achieved approximately 64% round-the-clock pa琀琀erns, and geographic locations with a broad range of demand, last year we also faced headwinds that made it carbon-free energy across all of our data center sites, electricity grid carbon intensities. In addition to helping more challenging to purchase CFE—including continued inclusive of those operated by third pa爀琀ies. Our 2022 CFE us achieve our own climate goals, pursuing CFE for our disruptions to renewable energy supply chains, delays represents a 2% change from 2021 (66% CFE), as a result o昀케ces can help expand clean energy options in the cities for interconnecting new utility-scale projects, and Golden Hills wind farm in California (43 MW for Google) of updating our metric this year to include third-pa爀琀y we call home. increased demand for clean energy projects. Adding to 43
 2023 Environmental Report Page 42 Page 44