
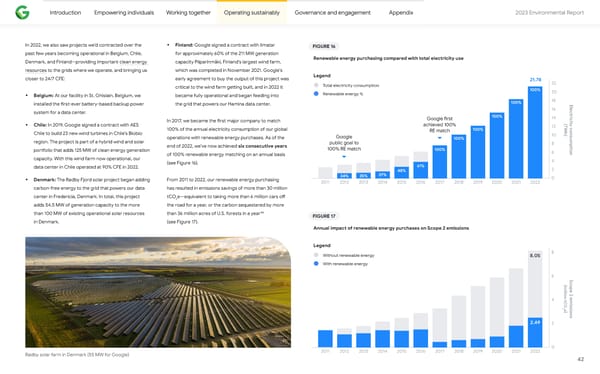
Introduction Empowering individuals Working together Operating sustainably Governance and engagement Appendix 2023 Environmental Repo爀琀 In 2022, we also saw projects we’d contracted over the • Finland: Google signed a contract with Ilmatar FIGURE 16 past few years becoming operational in Belgium, Chile, for approximately 60% of the 211 MW generation Renewable energy purchasing compared with total electricity use Denmark, and Finland—providing impo爀琀ant clean energy capacity Piiparinmäki, Finland’s largest wind farm, resources to the grids where we operate, and bringing us which was completed in November 2021. Google’s Legend closer to 24/7 CFE: early agreement to buy the output of this project was 21.78 22 Total electricity consumption critical to the wind farm ge琀琀ing built, and in 2022 it 100% 20 • Belgium: At our facility in St. Ghislain, Belgium, we became fully operational and began feeding into Renewable energy % 100% 18 installed the 昀椀rst-ever ba琀琀ery-based backup power the grid that powers our Hamina data center. El 16 e c system for a data center. 100% tri Google 昀椀rst 14 ci In 2017, we became the 昀椀rst major company to match (TWh)t • Chile: In 2019, Google signed a contract with AES achieved 100% 12 y c 100% of the annual electricity consumption of our global RE match 100% o Chile to build 23 new wind turbines in Chile’s Biobío n region. The project is pa爀琀 of a hybrid wind and solar operations with renewable energy purchases. As of the Google 100% 10 sump public goal to 8 end of 2022, we’ve now achieved six consecutive years t i po爀琀folio that adds 125 MW of clean energy generation 100% RE match 100% o capacity. With this wind farm now operational, our of 100% renewable energy matching on an annual basis 6 n 4 (see Figure 16). 61% data center in Chile operated at 90% CFE in 2022. 48% 2 34% 35% 37% 0 • Denmark: The Rødby Fjord solar project began adding From 2011 to 2022, our renewable energy purchasing 2011 2012 2013 2014 2015 2016 2017 2018 2019 2020 2021 2022 carbon-free energy to the grid that powers our data has resulted in emissions savings of more than 30 million center in Fredericia, Denmark. In total, this project tCO2e—equivalent to taking more than 6 million cars o昀昀 adds 54.5 MW of generation capacity to the more the road for a year, or the carbon sequestered by more 88 than 100 MW of existing operational solar resources than 36 million acres of U.S. forests in a year FIGURE 17 in Denmark. (see Figure 17). Annual impact of renewable energy purchases on Scope 2 emissions Legend 8 Without renewable energy 8.05 With renewable energy 6 Sc ( o mi pe 2 emiss l l i o n 4 tC 2O e i ) o n 2.49 2 s 0 2011 2012 2013 2014 2015 2016 2017 2018 2019 2020 2021 2022 Rødby solar farm in Denmark (55 MW for Google) 42
 2023 Environmental Report Page 41 Page 43